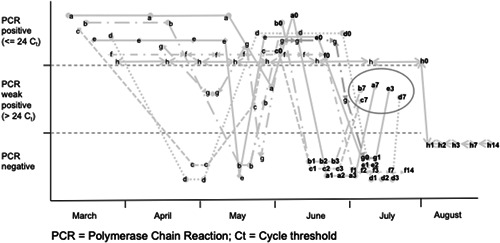
Figure 1.

Time course of swabs in the eight patients. Each patient is identified by a letter. Letters followed by numbers indicate their relationship to hydrogen peroxide intervention (ie: a0 indicates just before the intervention, a3 three days later, etc). The five rebounds are circled. C t, cycle threshold; PCR, polymerase chain reaction
