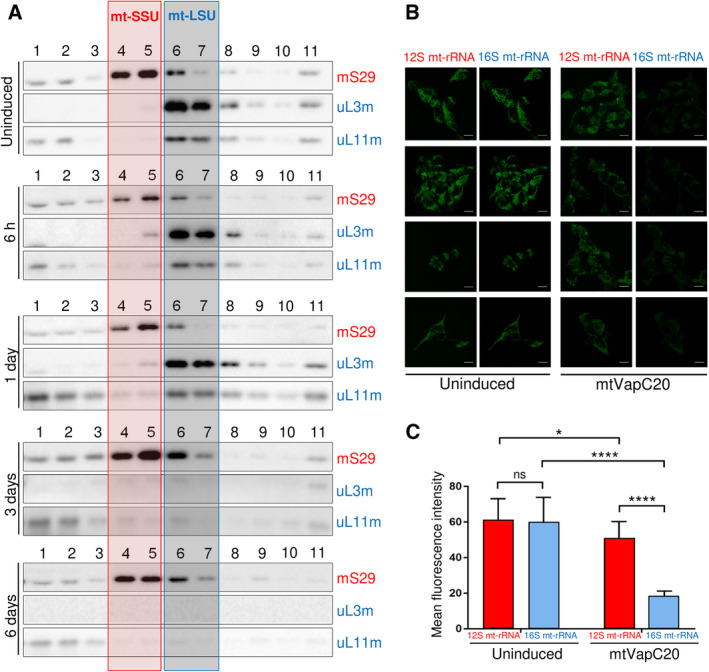
Fig. 4.

Effects of mtVapC20 expression on mitoribosomal components. (A) Isokinetic sucrose gradient centrifugation was used to analyse mitochondrial ribosomal protein distribution in mtVapC20 cells uninduced and induced for time periods as indicated. The migration of mt‐SSU (red box) and mt‐LSU (blue box) was determined using antibodies against mS29 (mt‐SSU), uL3m and uL11m (mt‐LSU). HUGO protein names: DAP3 (mS29); MRPL3 (uL3m); and MRPL11 (uL11m). Data are representative of two independent experiments. (B) Changes to distribution of 16S mt‐rRNA (in blue) and 12S mt‐rRNA (in red) in uninduced and mtVapC20‐expressing cells were determined by RNA FISH as described. For each sample, four representative confocal images are shown (scale bar: 10 µm). (C) Quantitative analysis of fluorescence intensities was performed using imagej and graphpad prism8 as detailed in Materials and methods. Results are presented as the mean ± SD (n = 9). Statistical analysis was performed using the Welch's T test (*P < 0.05; ****P < 0.0001).
