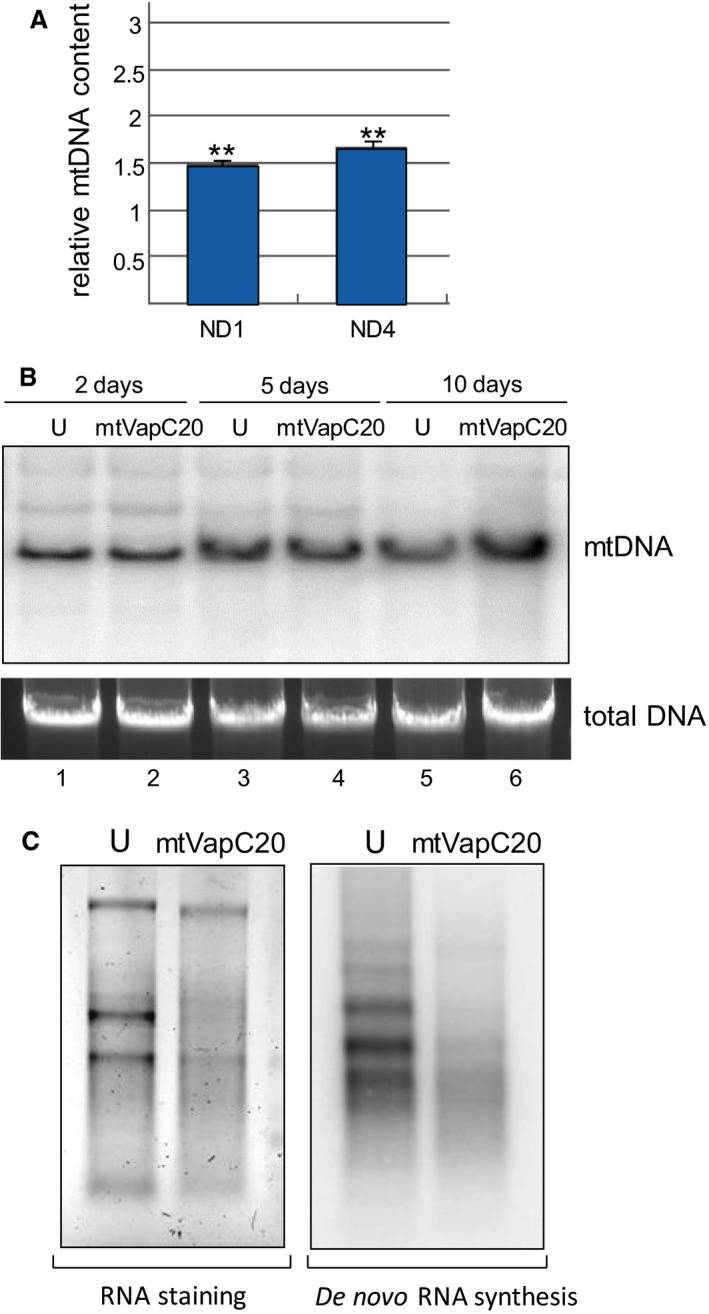
Fig. 6.

mtDNA levels and transcription in mtVapC20 cells. (A) Relative quantification of mitochondrial DNA levels by qPCR was performed after 10 days of induction. The relative mtDNA content of the induced mtVapC20 line was compared to uninduced control (set as equal to 1), normalized to 18S rRNA gene (endogenous control). Results are presented as the mean ± SD (n = 3). Statistical analysis was performed using one‐sample two‐tailed Student's t test (**P < 0.01). (B) Southern blot analysis was performed on total DNA isolated from uninduced (U) and cells induced (mtVapC20) for 2, 5 and 10 days. DNA (5 µg) was digested with BamHI, fractionated on a 0.7% agarose gel and electroblotted to nylon membrane. The filter was hybridized with radiolabelled probe for mitochondrial MTCO2 gene. Total DNA was stained by GelRed® (Biotium, Fremont, CA, USA) as loading control. Data for each different time point are representative of one experiment. (C) In organello transcription assay was performed on uninduced (U) and mtVapC20 cells induced for 6 days. Total RNA was stained by SYBR™ Gold (Thermo Fisher Scientific) as loading control, and radiolabel detected as previously described. Data are representative of one experiment.
