Figure 5.

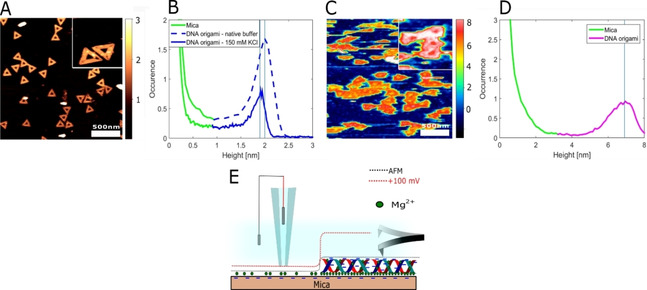
Images of DNA origami obtained by AFM and SICM: Height imaging and histograms of DNA nanostructures obtained by AFM (A, B) and SICM (C, D). E) Schematic illustration of scan profiles obtained by AFM and SICM at +100 mV.

Images of DNA origami obtained by AFM and SICM: Height imaging and histograms of DNA nanostructures obtained by AFM (A, B) and SICM (C, D). E) Schematic illustration of scan profiles obtained by AFM and SICM at +100 mV.