FIGURE 10.

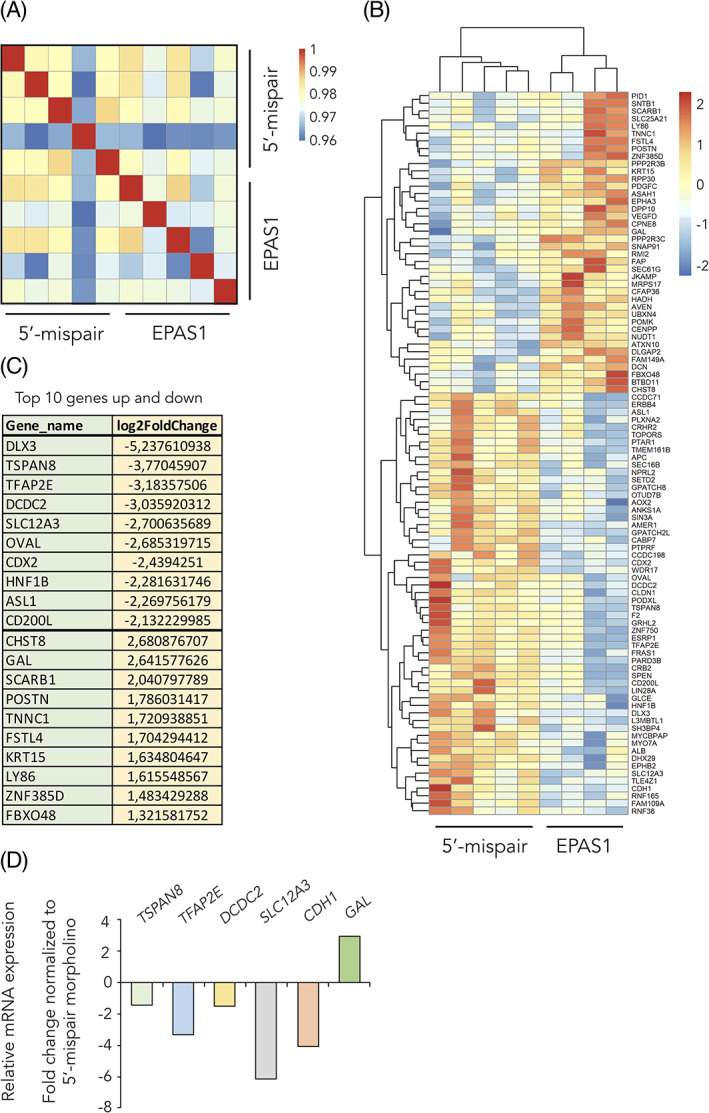
RNA sequencing identifies hypoxia inducible factor (HIF)‐2α downstream genes. A,B, Hierarchical clustering of significantly differentially expressed genes (DEGs; cut‐off P < .005) identified from RNA sequencing comparing 5′‐mispair and EPAS1 morpholino samples. C, List of the top 10 upregulated and top 10 downregulated genes from the RNA sequencing data. D, Relative mRNA expression as measured by qPCR. Samples from Figure 3D,E. EPAS1 morpholino sample was normalized to that of 5′‐mispair control to obtain fold change in expression
