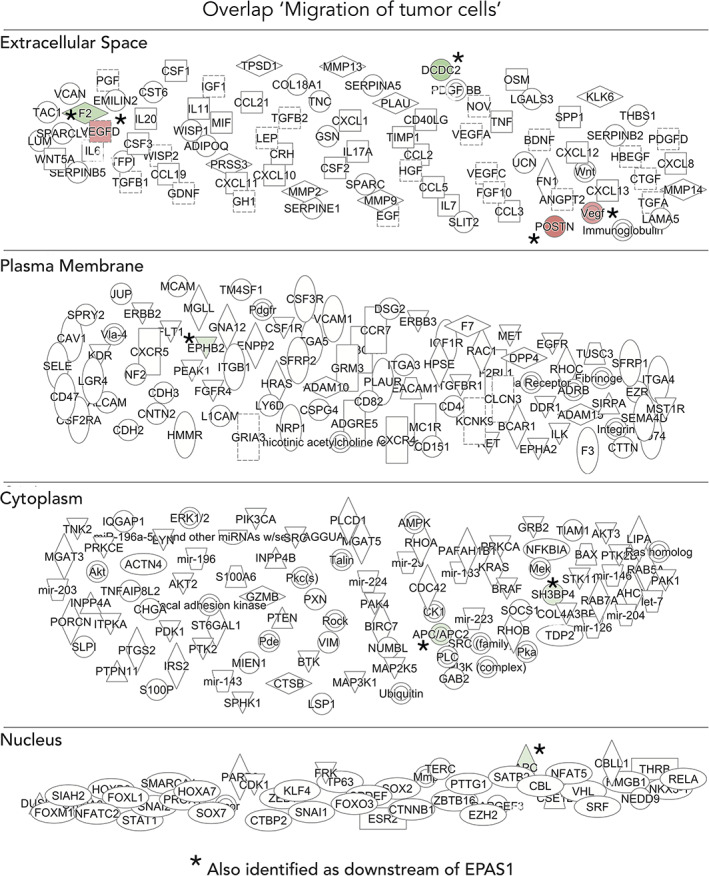
FIGURE 14.

Gene set enrichment analysis identifies key molecules for migration of tumor cells. Deeper analysis of overlap of genes involved in downstream process “migration of tumor cells” (Figure 11A,B) and genes from RNA sequencing data. The shape of molecules and their meaning, that is, correspondence to protein family and so forth, is found here: http://qiagen.force.com/KnowledgeBase/KnowledgeIPAPage?id=kA41i000000L5rTCAS. As an example, the diamond‐shaped molecules correspond to enzymes, oval standing shapes should be read as transmembrane receptors and lying oval shapes are transcription regulators. Green nodes indicate downregulated molecules. The intensity of the color reveals the strength of the expression, that is, the stronger the color the more significant. The dashed lines indicate an indirect interaction between molecules in the network whereas solid lines are direct interactions. The solid arrow explains the direction of the indicated interaction. A line, solid, or dashed, without an arrowhead indicate an RNA‐RNA interaction
