
Figure 4.
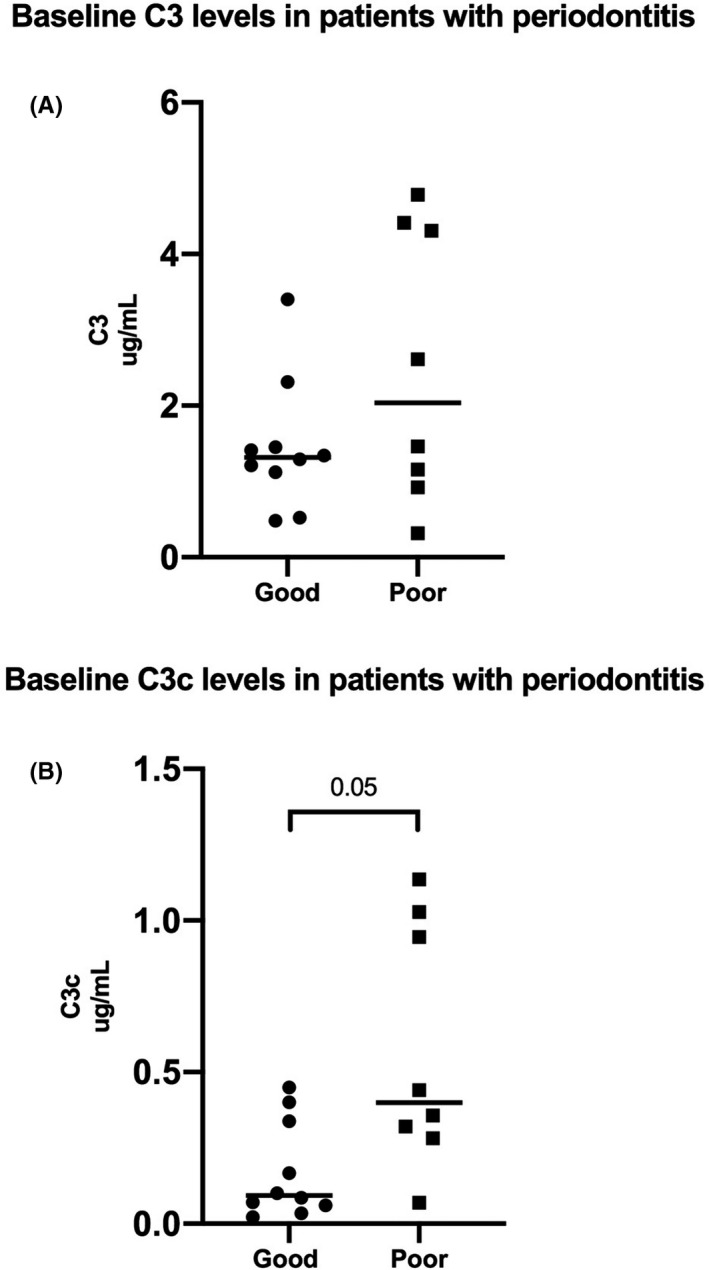
Baseline salivary C3 and C3c levels in good and poor responders to non‐surgical periodontal treatment. The scatter dot‐plots illustrate baseline saliva levels of (A) C3 (P > .05) and (B) C3c (P < .05) in good responders (n = 10) compared with poor responders (n = 8). The horizontal lines show the median levels in the two groups