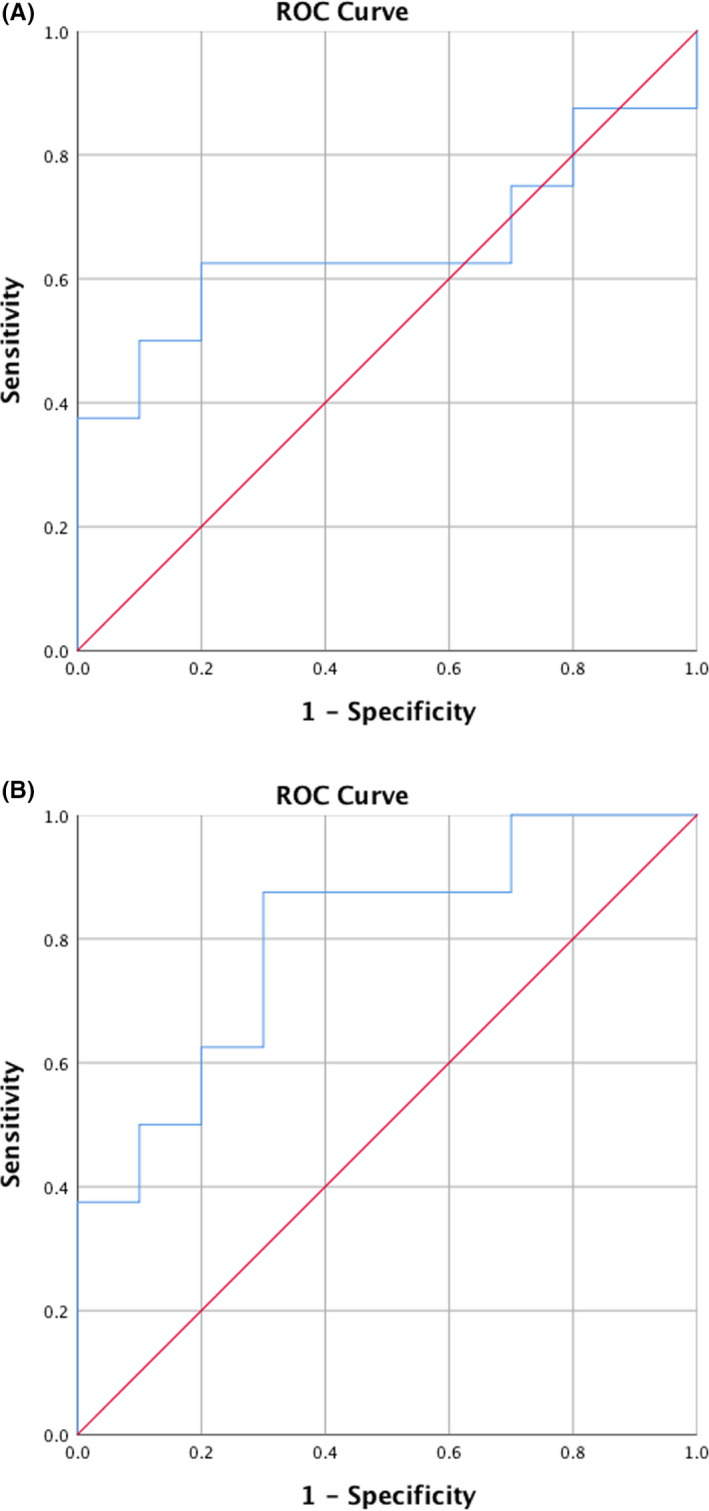
Figure 5.

AUC for total C3 and C3c at baseline in identifying poor responders to non‐surgical periodontal treatment. ROC analysis of salivary baseline levels of A = C3 and B = C3c to discriminate between the good (n = 10) and the poor (n = 8) responders to periodontal treatment. (A) C3, AUC = 0.65, CI = [0.36;0.94], (P > .05) and (B) C3c, AUC = 0.80, CI = [0.59;1.00], (P < .05)
