
Figure 2.
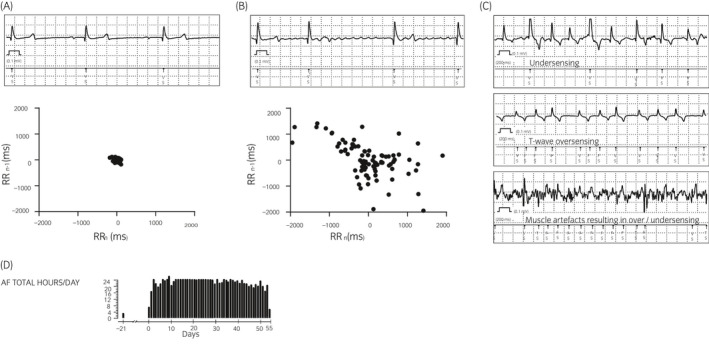
Examples of electrocardiograms (ECGs) and Lorenz plots at rest in sinus rhythm (A) and atrial fibrillation (B) recorded by the implantable loop at location Left‐6. Artefact recordings (C) corresponding to undersensing, T‐wave oversensing and muscle artefact over/undersensing. Representative AF burden histogram (D) showing h/d of AF registered by a single ILR