Figure 2.

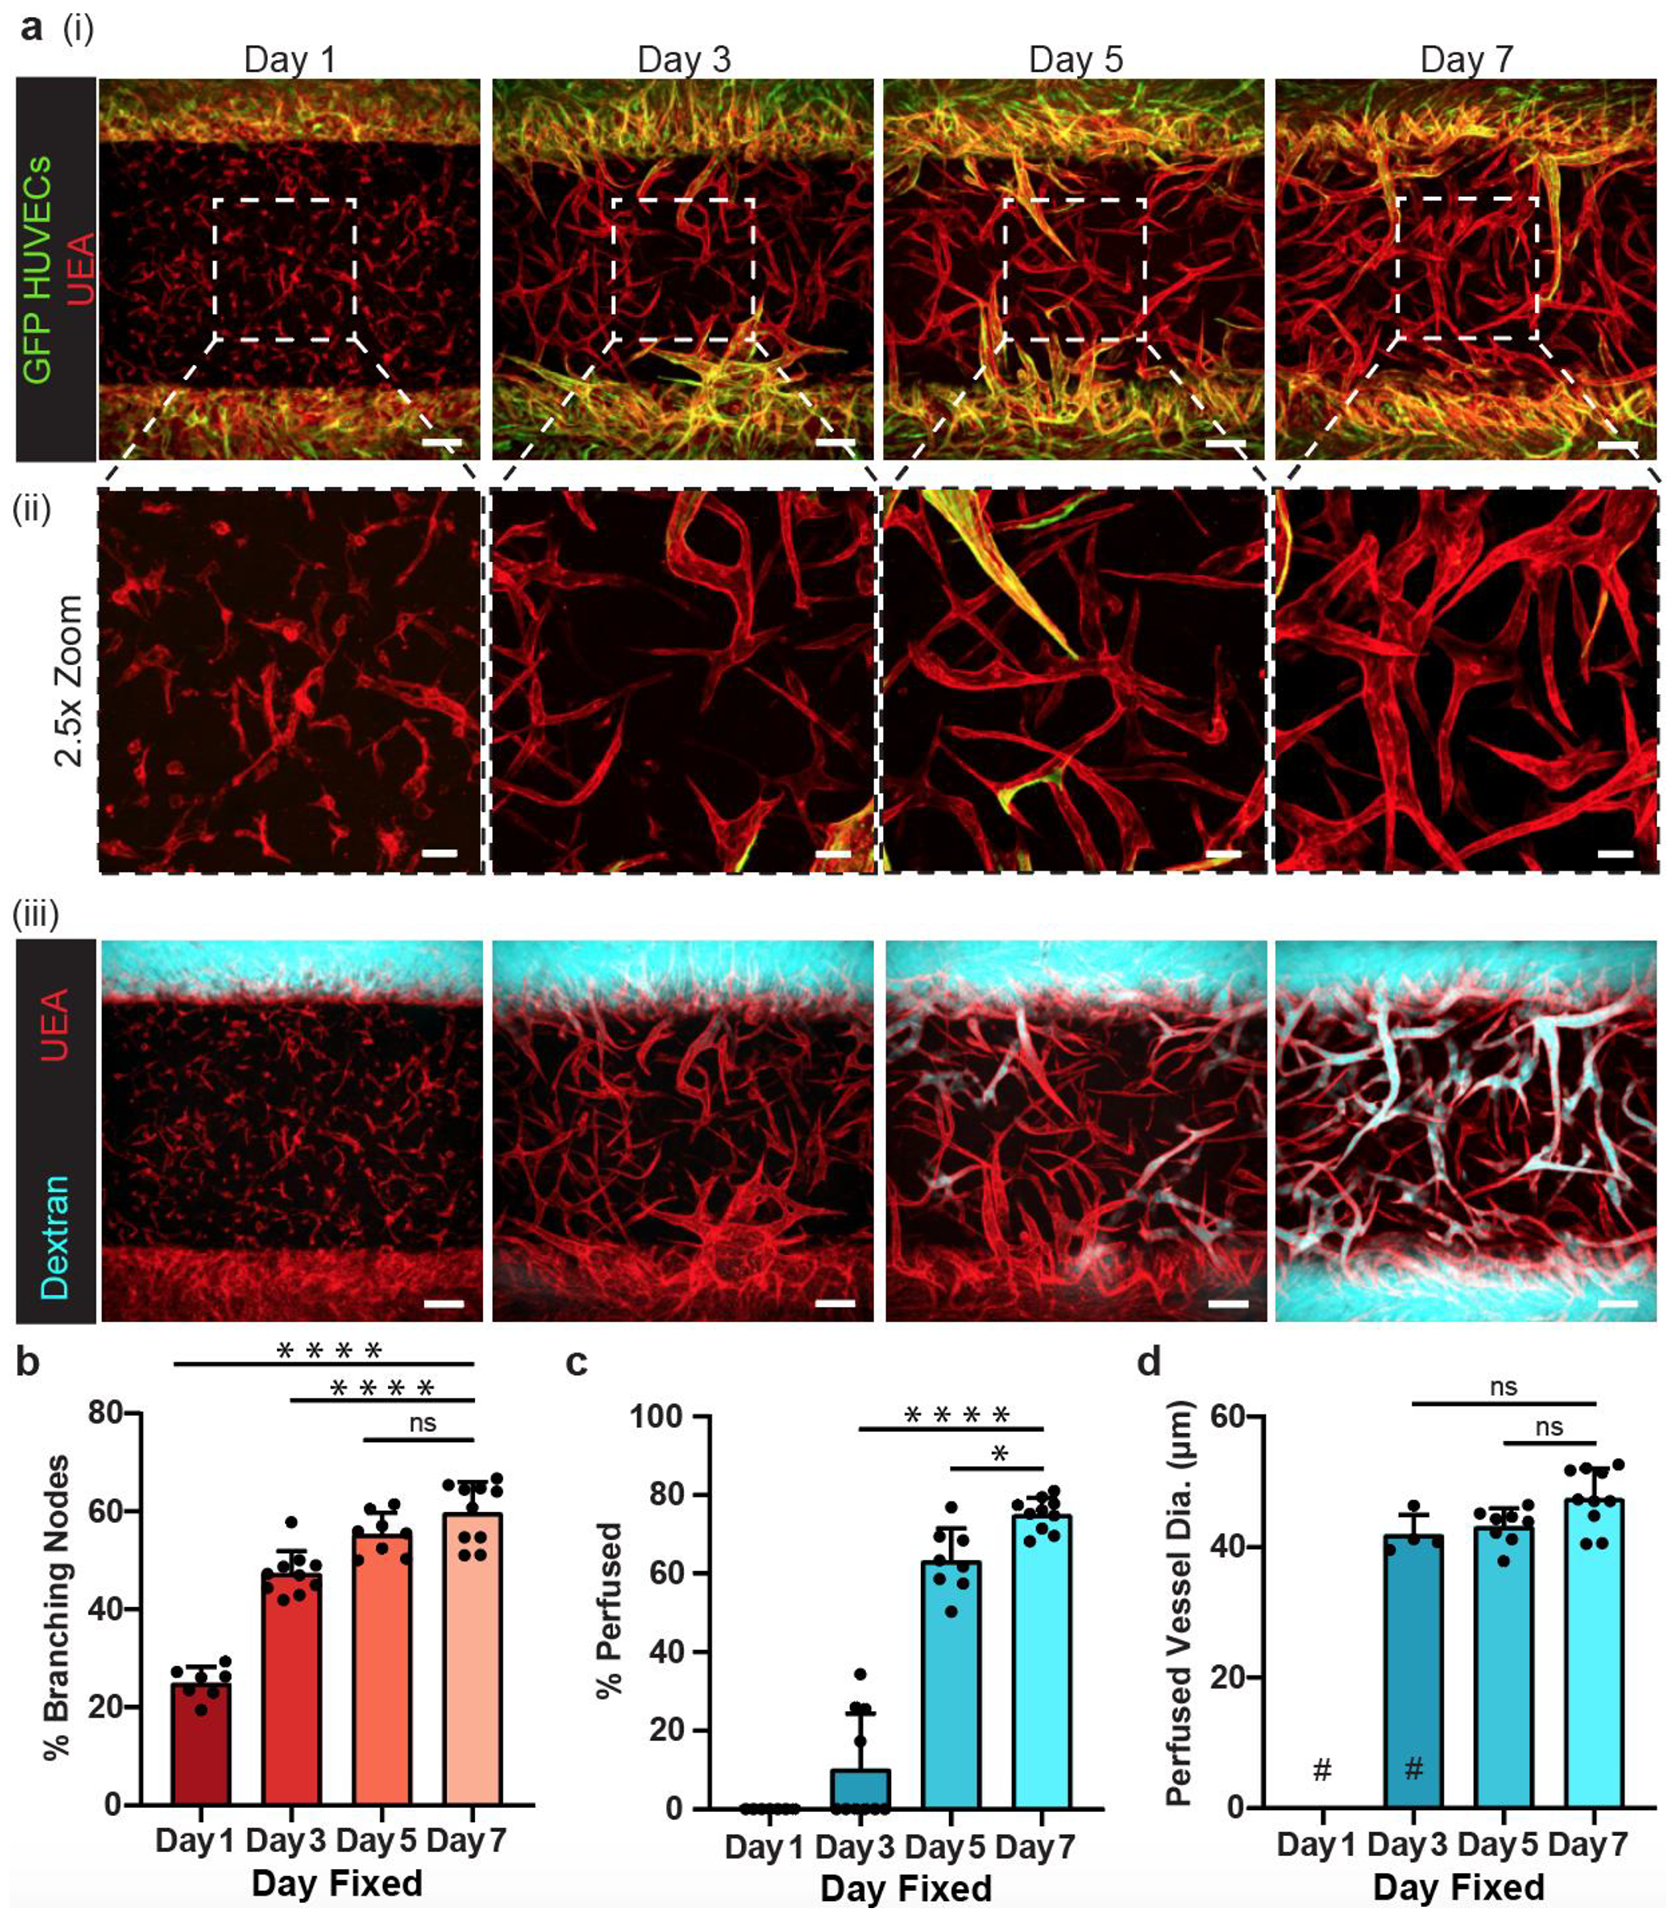
Daily fixations show vasculogenesis formation and functionality. a) (i) Representative images of growth progression from multicellular structures to functionally connected vasculature. GFP-expressing HUVECs (green) were seeded in the needle lumen only and eventually complex with the endothelial cells originating in the bulk gel. (ii) 2.5x zoomed images of the center of the devices. (iii) Same devices shown in (i) with dextran perfusion (cyan) shown along with UEA lectin (red). b) Quantification of percentage of branching nodes, c) percentage of vessels perfused, and d) average diameter of perfused vessels in devices. # represents where data points removed due to no vessels being perfused in those devices. *: p < 0.05, ****: p < 0.0001, ns = not significant. Scale bars a) (i) and (iii) = 150 μm and a) (ii) = 50 μm.
