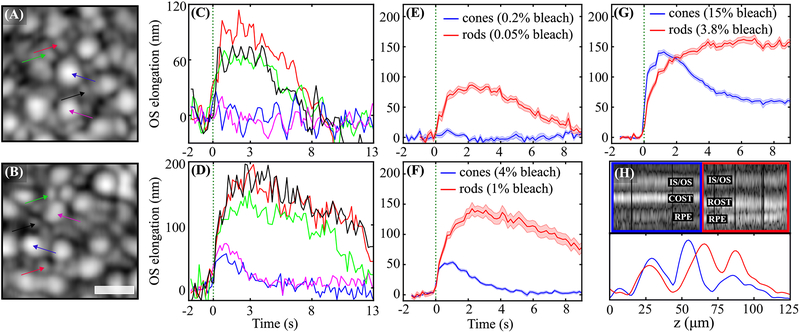
Fig. 2.
(A) and (B) show the OCT en face projections acquired 6° temporal to the fovea in two trials of different stimulus intensities, while (C) and (D) show plots of the corresponding elongation of select rods and cones in the field, and (E) and (F) show the corresponding averaged responses of 10–20 cones and rods. In (A), (C), and (E), the flash bleached 0.2% and 0.05% of L/M photopigment and rod pigment, respectively, while the brighter flash in (B), (D), and (F) bleached 4.0% and 1.0%, respectively. No cone elongation is visible in response to the dimmer flash in (C) and (E), whereas a clear rod response is visible. In response to the brighter flash in (D) and (F), both rods and cones elongate, with the elongation of rods having several times higher amplitude. The averaged cone and rod responses to a still brighter flash, which bleached 15% and 3.75%, are shown in (G), where the cone response appears to have a higher initial slope and the rod response appears to saturate. Together these results are consistent with key fundamental differences between the cells—that cone responses are faster but less sensitive than those of rods. M-scans of a single cone and rod from the field are shown in (H), along with plots of their time-averaged axial reflectance profiles. The longer OS of the rod and corresponding distal displacement of its OS tip are clearly visible. This morphological difference aids in classification of the cells, and also guards against cross talk of their responses due to lateral blur. Colors of arrows in (A) and (B) correspond to line colors in (C) and (D), and shaded regions in (E)–(G) represent the standard error of the mean (±SEM). The scale bar is 10 μm.

