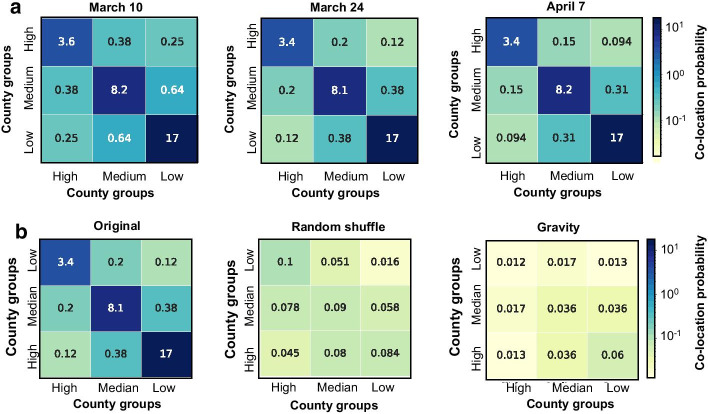
Fig. 6.
(a) Co-location probability across different county groups for three different time periods. (b) The results generated were based on original data (24 March 2020), random shuffle, and gravity model with input of population size for testing the significance of the segregation of co-location patterns based on travel across different county groups. The value in each cell is the sum of the co-location probabilities of the same type of edges. High, medium, and low groups are the groups of counties which are ranked by the number of confirmed cases on 31 March 2020 (the ranks based on the data in different weeks were performed as a sensitivity test provided in Additional file 1). The sizes of the groups are equal (about 1,000 counties per group). The color bar is consistent for the heat maps in the same subplot

