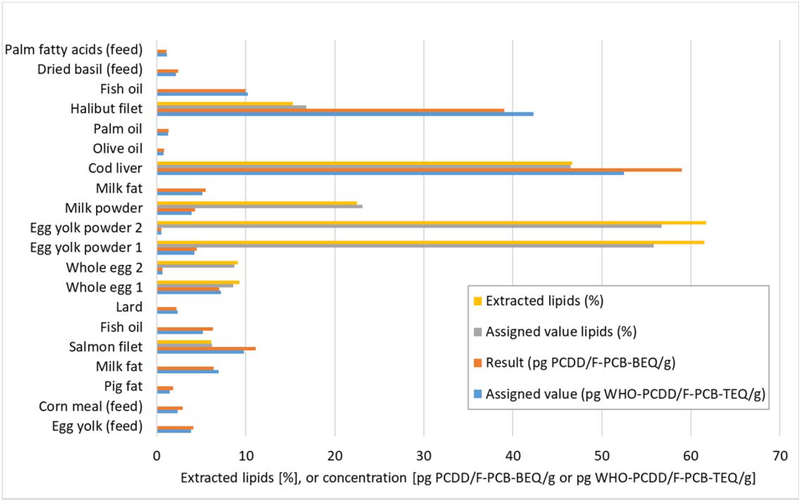
Figure 10.
Results from participation in proficiency testing (PT) studies organized 2010–2017 for National Reference Laboratories (NRLs) and Official Laboratories (OFLs), covering 16 EU-regulated food samples and 4 feed samples (“feed”). Assigned values and results for extracted lipids (where applicable) and for the sum of PCDD/Fs and DL-PCBs (for numerical values see Table 6).

