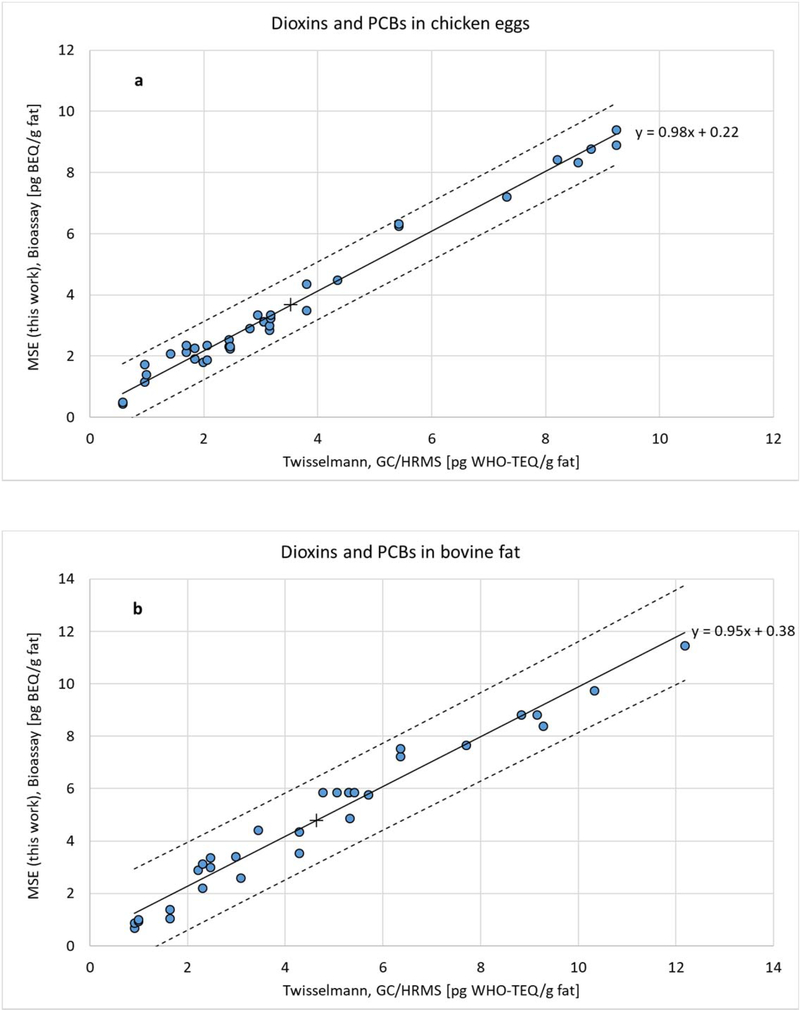
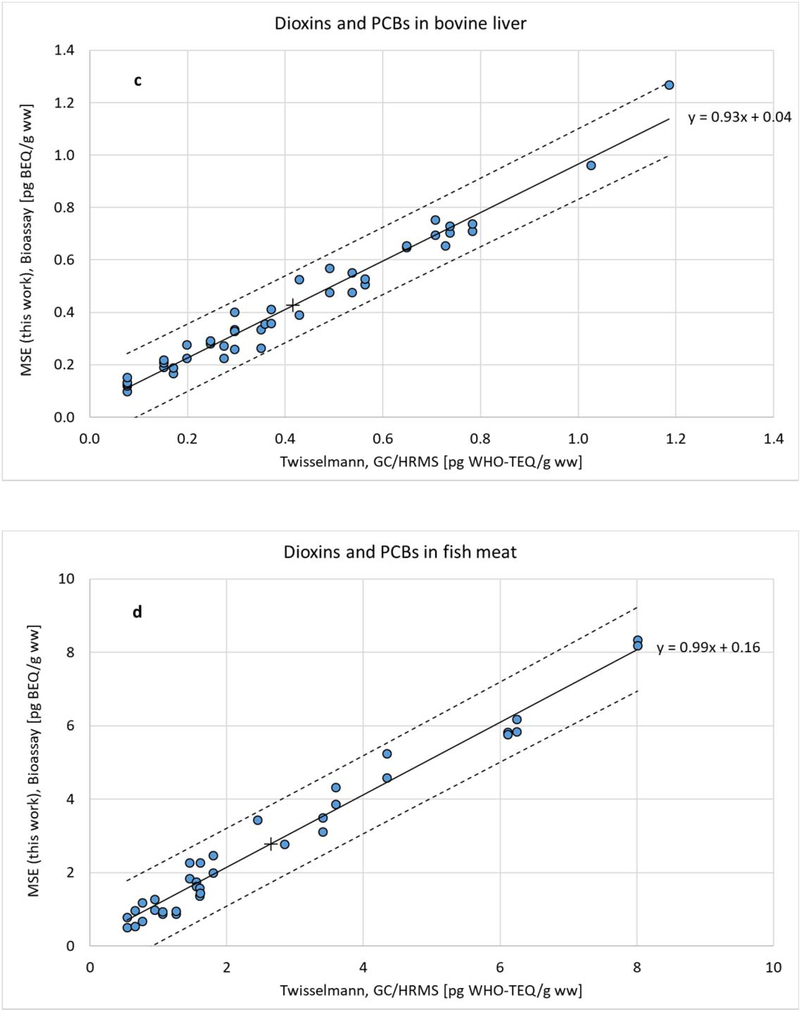
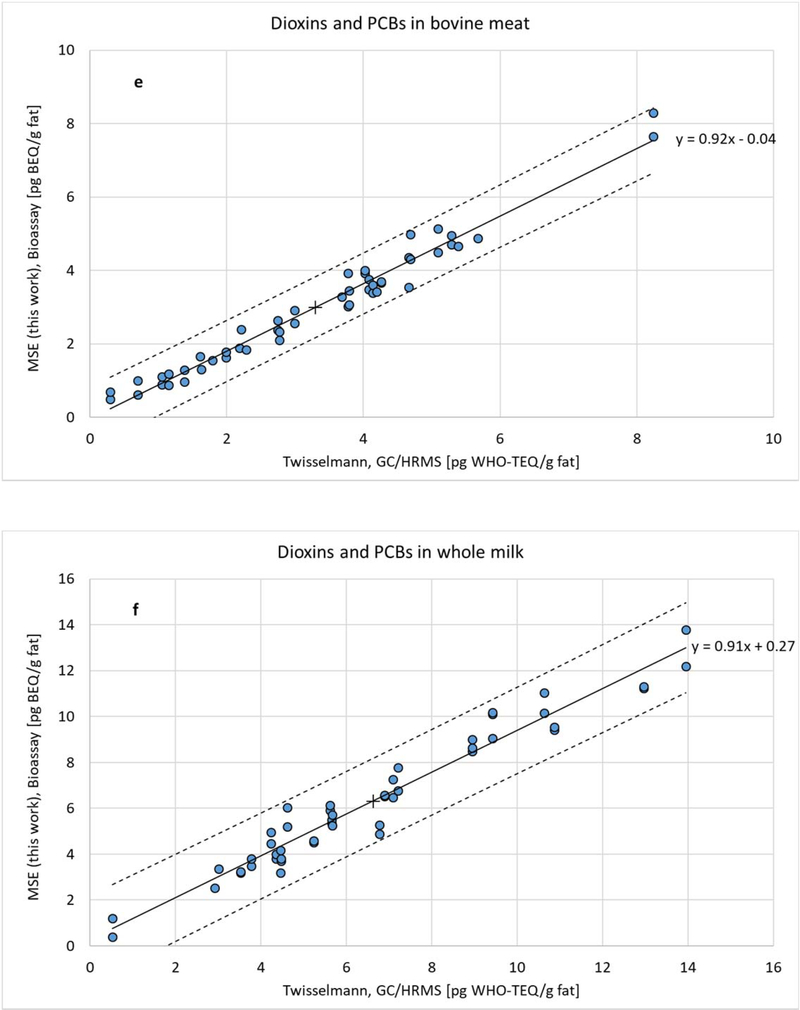
Figure 9.
Method calibration: Dioxins and PCBs in a chicken eggs, b bovine fat, c bovine liver, d fish meat, e bovine meat and f (human) whole milk. Results from modified Smedes [46] extraction (MSE, this work) followed by CALUX bioassay analysis (pg BEQ/g fat, or ww), and from Twisselmann [65] extraction followed by GC/HRMS (pg WHO-TEQ/g fat, or ww); – regression line, -- 95% prediction intervals, + centre of mass.


