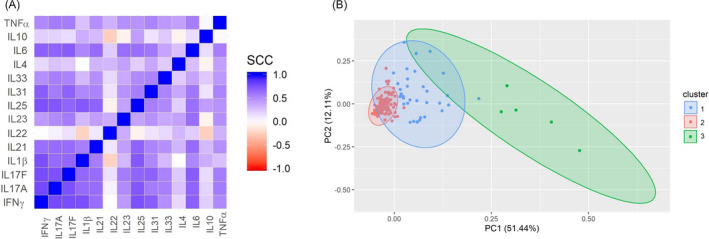
FIGURE 2.

Cytokine correlations and PCA analysis. (A) A heatmap of the cytokine correlations was performed. A strong correlation was observed in almost all of the cytokines between themselves. B, PCA graphic of the two principal components and the clusters observed according to cytokine levels. SCC, Spearman correlation coefficient
