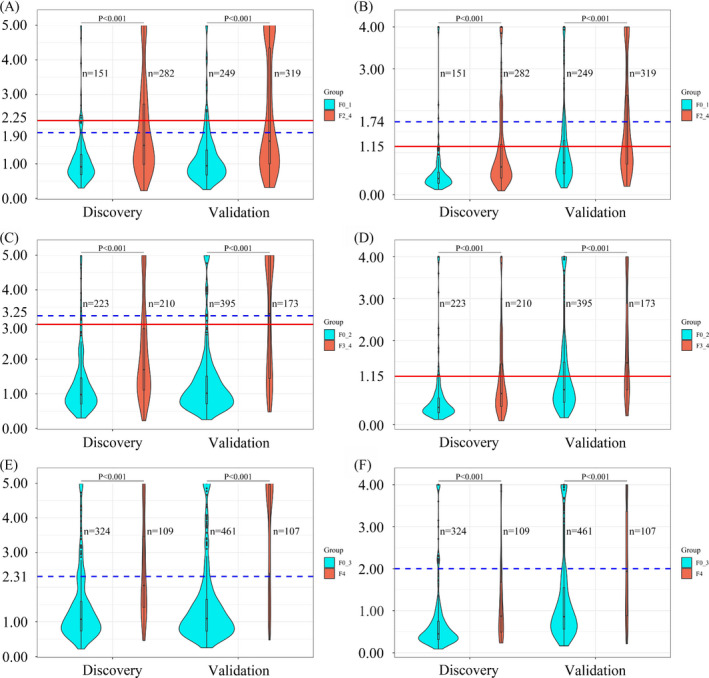
Figure 1.

Violin plots showing the distribution of FIB‐4 and APRI scores within different hepatic fibrosis stages, with overlay boxplots displaying medians and upper and lower quartiles. (A) FIB‐4 scores between stage F0‐1 and stage F2‐4, (B) APRI scores between stage F0‐1 and stage F2‐4, (C) FIB‐4 scores between stage F0‐2 and stage F3‐4, (D) APRI scores between stage F0‐2 and stage F3‐4, (E) FIB‐4 scores between stage F0‐3 and stage F4, and (F) APRI scores between stage F0‐3 and stage F4. In each figure, the area of the violin plot is proportional to the number of patients. The blue dotted lines indicate pre‐defined thresholds, and solid red lines indicate newly defined thresholds. The P values were calculated using the Wilcoxon rank‐sum test
