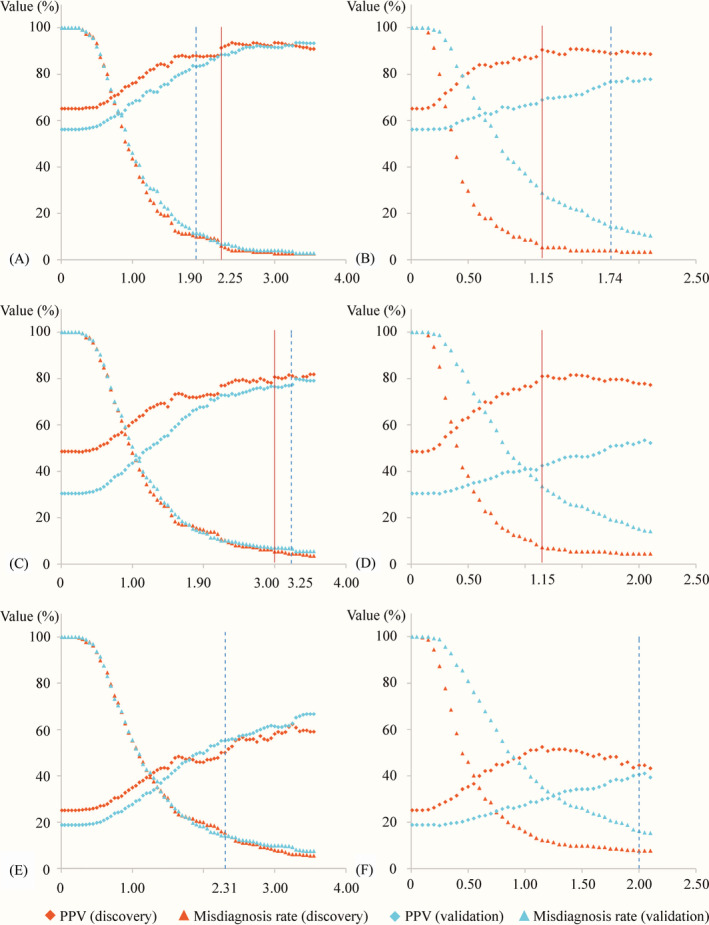
Figure 2.

Scatterplots showing PPVs and misdiagnosis rates based on hypothetical cutoffs. (A) FIB‐4 score for ruling in stage F2‐4, (B) APRI score for ruling in stage F2‐4, (C) FIB‐4 score for ruling in stage F3‐4, (D) APRI score for ruling in stage F3‐4, (E) FIB‐4 score for ruling in stage F4, and (F) APRI score for ruling in stage F4. The blue dotted lines indicate pre‐defined thresholds, and solid red lines indicate newly defined thresholds
