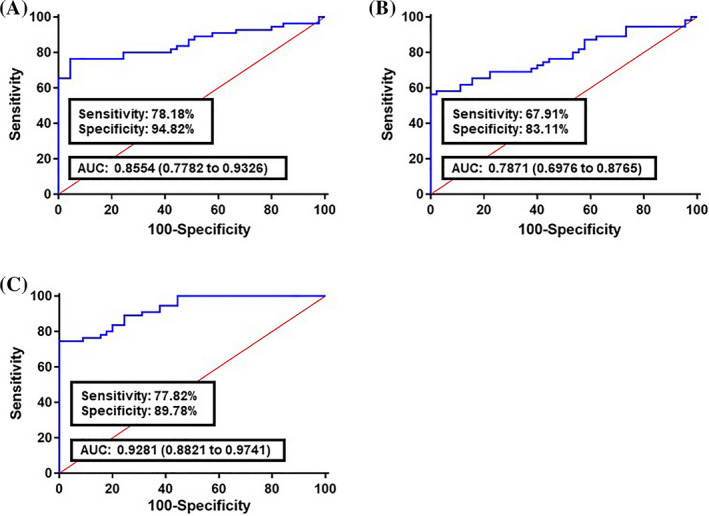
Figure 2.

Receiver operating characteristics (ROC) curve analysis of the logit model with fecal lncRNAs CCAT1, CCAT2, H19, HOTAIR, HULC, MALAT1, MEG3, PCAT1, PTENP1, and TUSC7, on the training set. A, The area under the ROC curve (AUC) assessment of the logit(p) value for the fecal lncRNAs panel in istinguishing colorectal cancer (CRC) cases (All TNM stages) from the healthy controls. B, AUC assessment of the logit(p) value for the fecal lncRNAs panel in distinguishing the early CRC stages (I‐II TNM stages) from the healthy controls. C, AUC assessment of the logit(p) value for the fecal lncRNAs panel in distinguishing the advanced CRC stages (III‐IV TNM stages) from the healthy controls. logit(p) = 27.886 − 0.1969 × (CCAT1) − 0.1904 × (CCAT2) − 0.2986 × (H19) − 0.6895 × (HOTAIR) − 0.1194 × (HULC) − 0.3598 × (MALAT1) − 0.1278 × (MEG3) − 0.1744 × (PCAT1) − 0.9081 × (PTENP1) − 0.8469 × (TUSC7)
