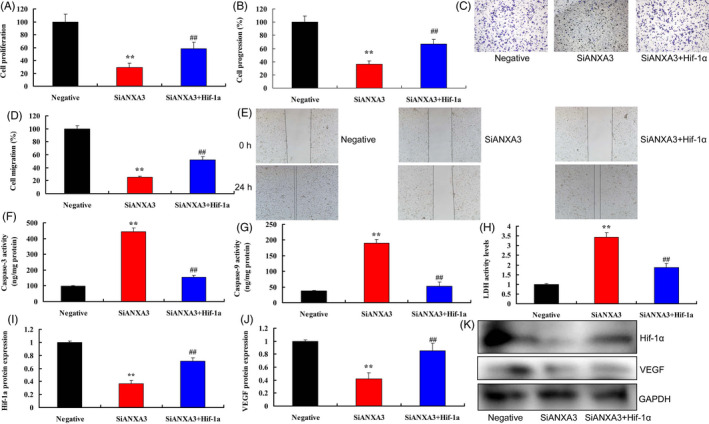
Figure 6.

The induction of HIF‐1α in the pro‐cancer effects of ANXA3 on melanoma. Cell growth (A), cell progression (B and C), cell migration (D and E), LDH activity and caspase‐3/9 activity levels (F‐H), HIF‐1α/VEGF expression (I‐K). Negative, negative group; si‐ANXA3, 50 ng of siANXA3 group; si‐ANXA3 + HIF‐1α, 50 ng of si‐ANXA3 group, and up‐regulation of HIF‐1α. **P < .01 versus negative group, *P < .01 versus 50 ng of ANXA3
