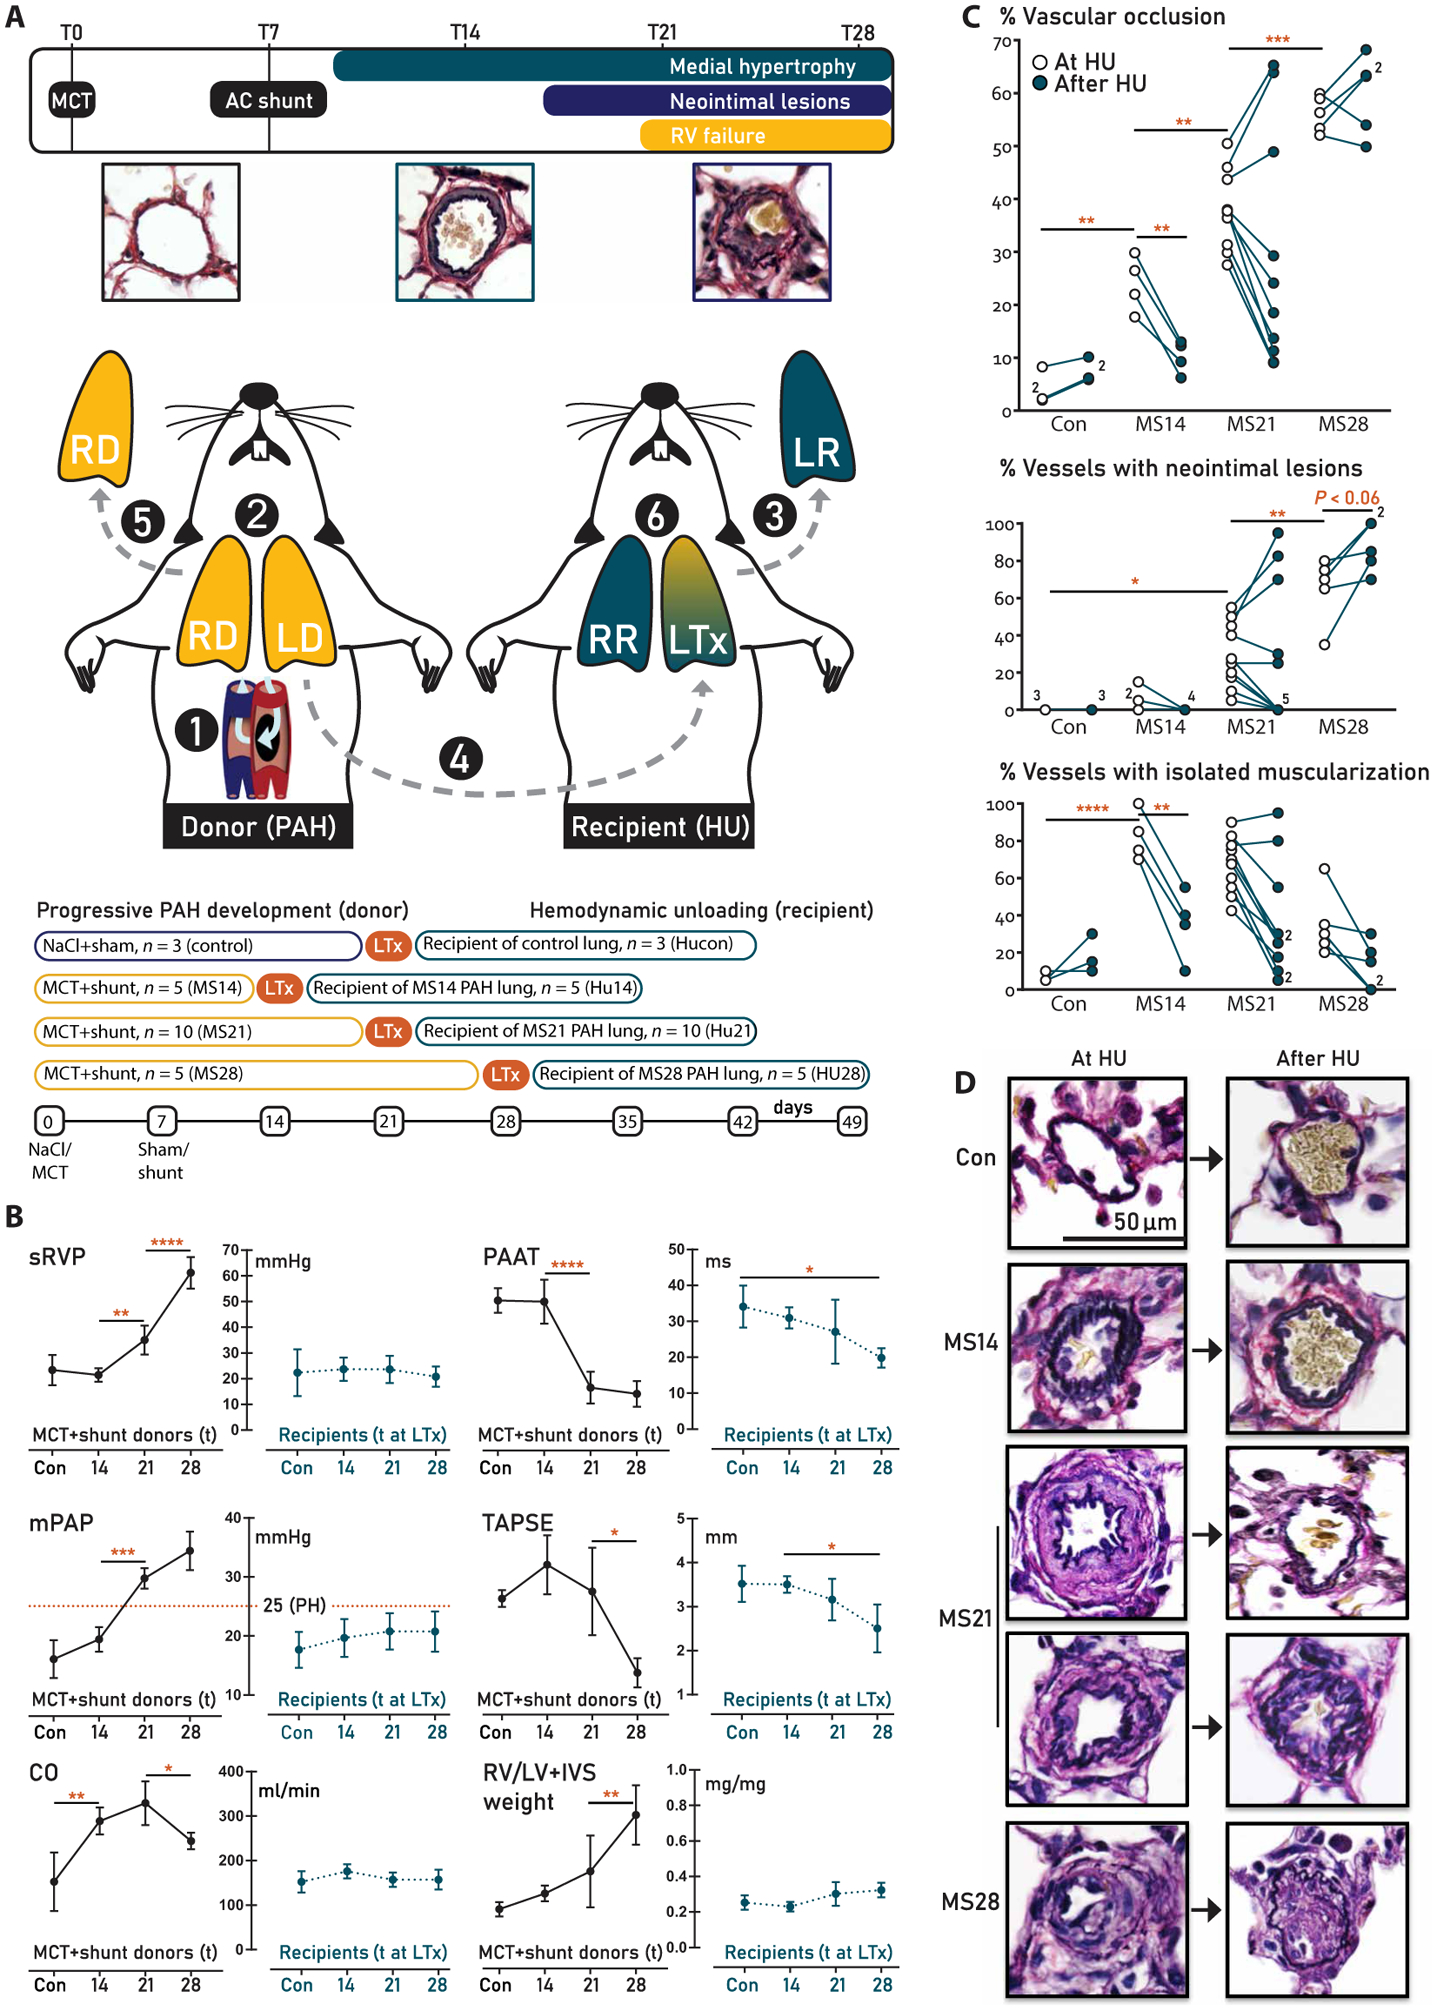
Fig. 1. Study design and hemodynamic and vascular morphologic evaluation.

(A) Experimental design. Step 1: PAH was induced by an injection of monocrotaline [MCT; 60 mg/kg, day 0 (T0)] and creation of an aortocaval (AC) shunt, which increases cardiac output (CO) twofold [see (B)]. Step 2: Donor rats developed early, advanced, and end-stage PAH after 14, 21, and 28 days, respectively. Step 3: The left lung of a normotensive, healthy recipient rat was explanted (LR). Step 4: To mimic hemodynamic unloading (HU), the left donor lung (LD) with different PAH stages was transplanted into the recipient. Step 5: The right donor lung (RD) was explanted and used to assess the PAH stage at HU. The donor rat was sacrificed. Step 6: 21 days after transplantation, the recipient rat was sacrificed. The transplanted lung (LTx) was used to assess the effect of HU of lungs with the different stages of PAH. RV, right ventricular; RR, right lung of recipient rat. (B) Hemodynamic evaluation. The variables measured in the donor rat at the time point of HU are indicated in black; those in the recipient 21 days after HU are indicated in teal. N = 5 per PAH group, n = 3 for controls. sRVP, systolic RV pressure; mPAP, mean pulmonary artery pressure; TAPSE, tricuspid annular plain systolic excursion; PAAT, pulmonary artery acceleration time; RV/LV+IVS, RV to left ventricular plus septal weight ratio. The red dotted line in mPAP panels indicates pulmonary hypertension. (C) Quantification of vascular remodeling and (D) representative examples of Verhoeff staining. Left: Representative examples of the intra-acinar vessels at the different time points of PAH progression, showing progressive medial hypertrophy (MS14 and MS21) and the development of a neointima (MS21 and MS28). Right: Representative examples of the effect of HU after 21 days, showing normalization of the MS14 and some MS21 stages, and progressive remodeling, leading to acellular neointimal fibrosis of the other MS21 and all MS28 PAH stages. Data are reported as means ± SD. Statistics by one-way ANOVA with Bonferroni correction or Kruskal-Wallis with Dunn’s correction. Relevant significant differences are indicated with a black bar and asterisk. *P < 0.05, **P < 0.01, ***P < 0.001, and ****P < 0.0001.
