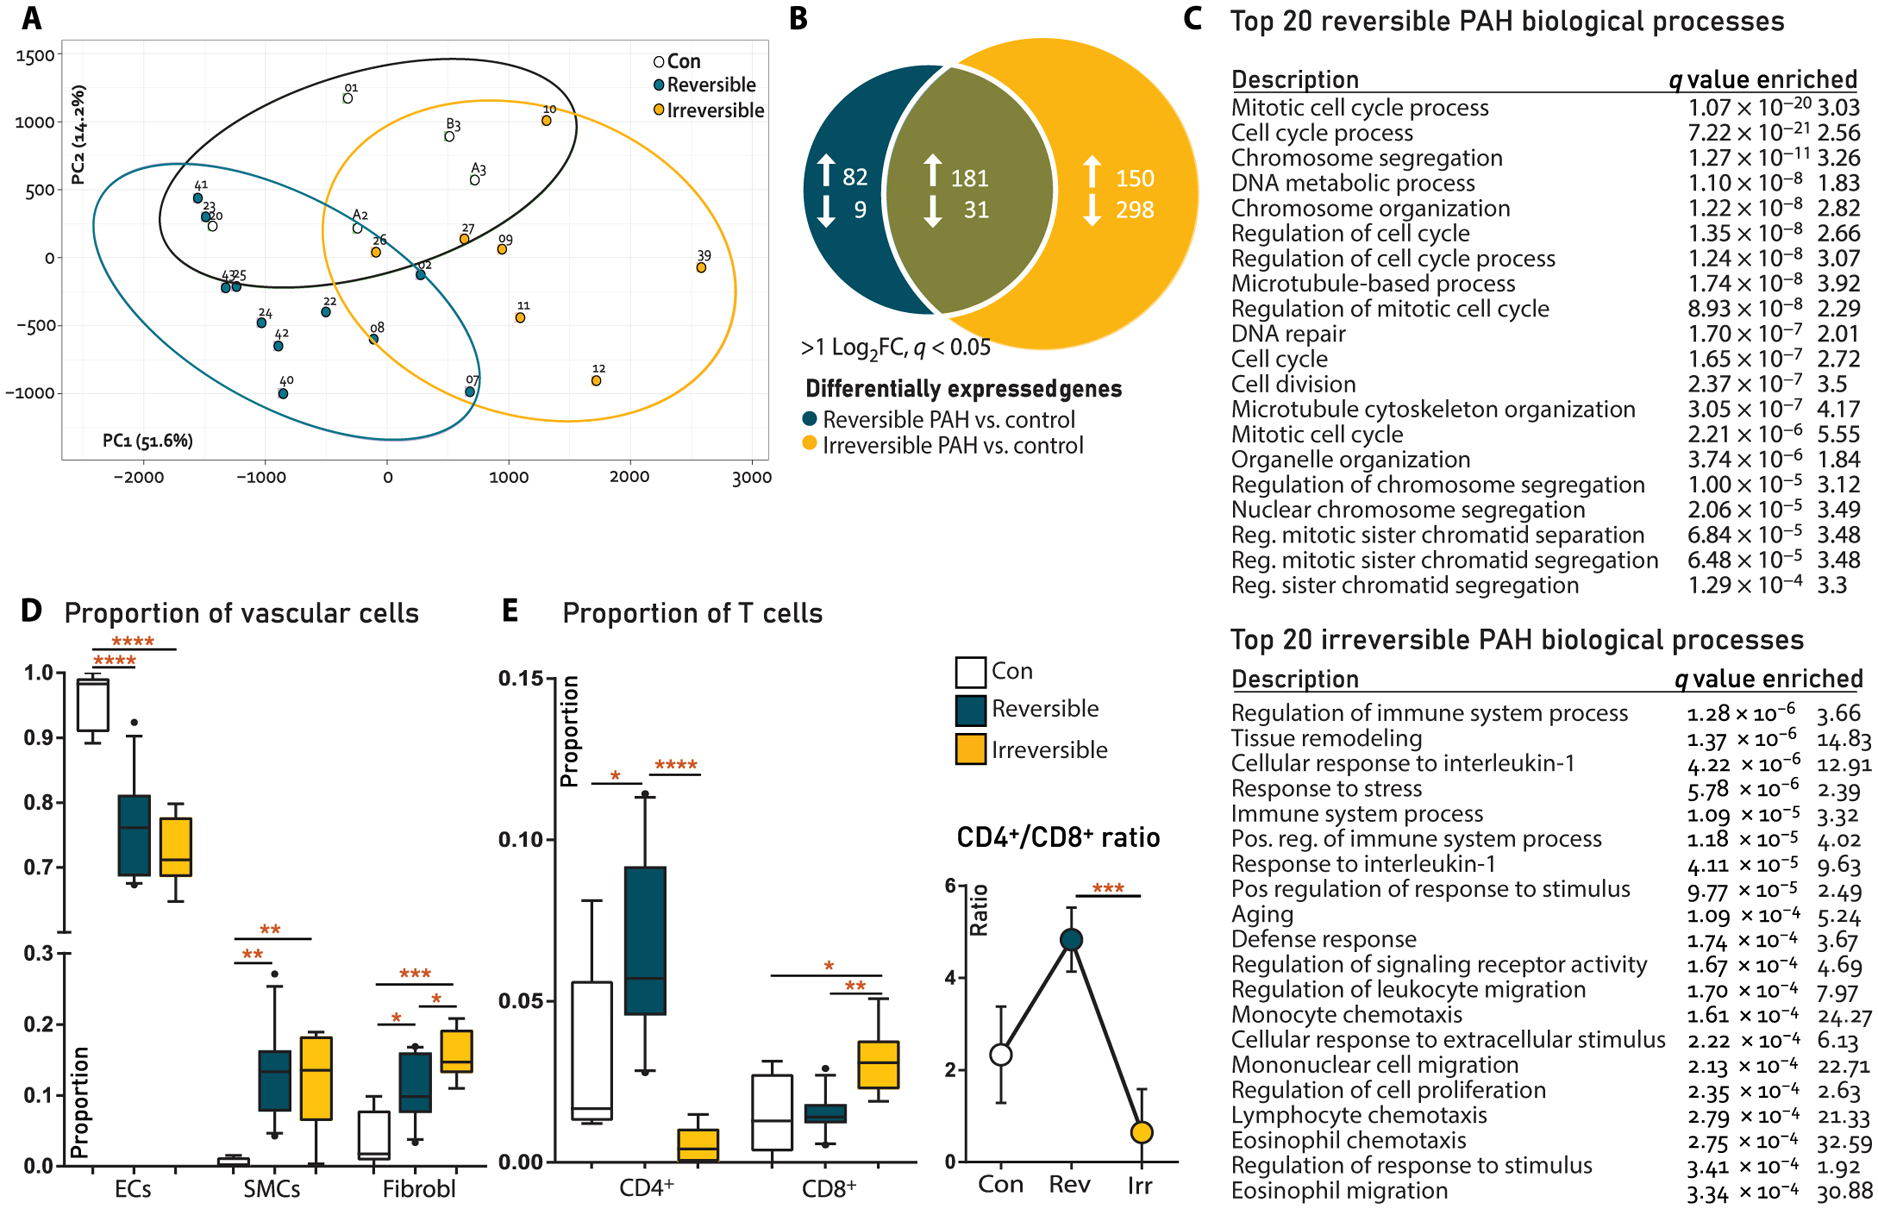
Fig. 2. RNA-seq analysis and cellular deconvolution of rat lung tissue.

(A) Principal components analysis showing clustering of reversible versus irreversible PAH in component 1. (B) Venn diagram of differentially expressed genes (DEGs) at q < 0.01 and >2log2FC cutoffs. (C) List of 20 most enriched biological processes associated to reversible or irreversible PAH only (pathway analysis). (D) Deconvolution for vascular cells, analyzing endothelial cell (EC) versus smooth muscle cell (SMC) and fibroblast (Fibrobl) proportions. Con, N = 5; reversible, N = 11; irreversible, N = 7. (E) Deconvolution for immune cells, showing CD4+ T cells versus CD8+ T cells (left) and CD4+/CD8+ T cell ratios (right). Con, N = 5; reversible, N = 11; irreversible, N = 7. Statistical analyses (A to C) performed on raw reads using pathway analysis algorithm in R. Cellular deconvolution analyses (D and E) performed on raw reads using the support vector regression algorithm in R; also, see cellular deconvolution (Materials and Methods). Data are reported as means ± SD. Statistical differences in (D and E) were assessed by one-way ANOVA with Bonferroni correction. Relevant significant differences are indicated with a black bar and asterisk. *P < 0.05, **P < 0.01, ***P < 0.001, and ****P < 0.0001.
