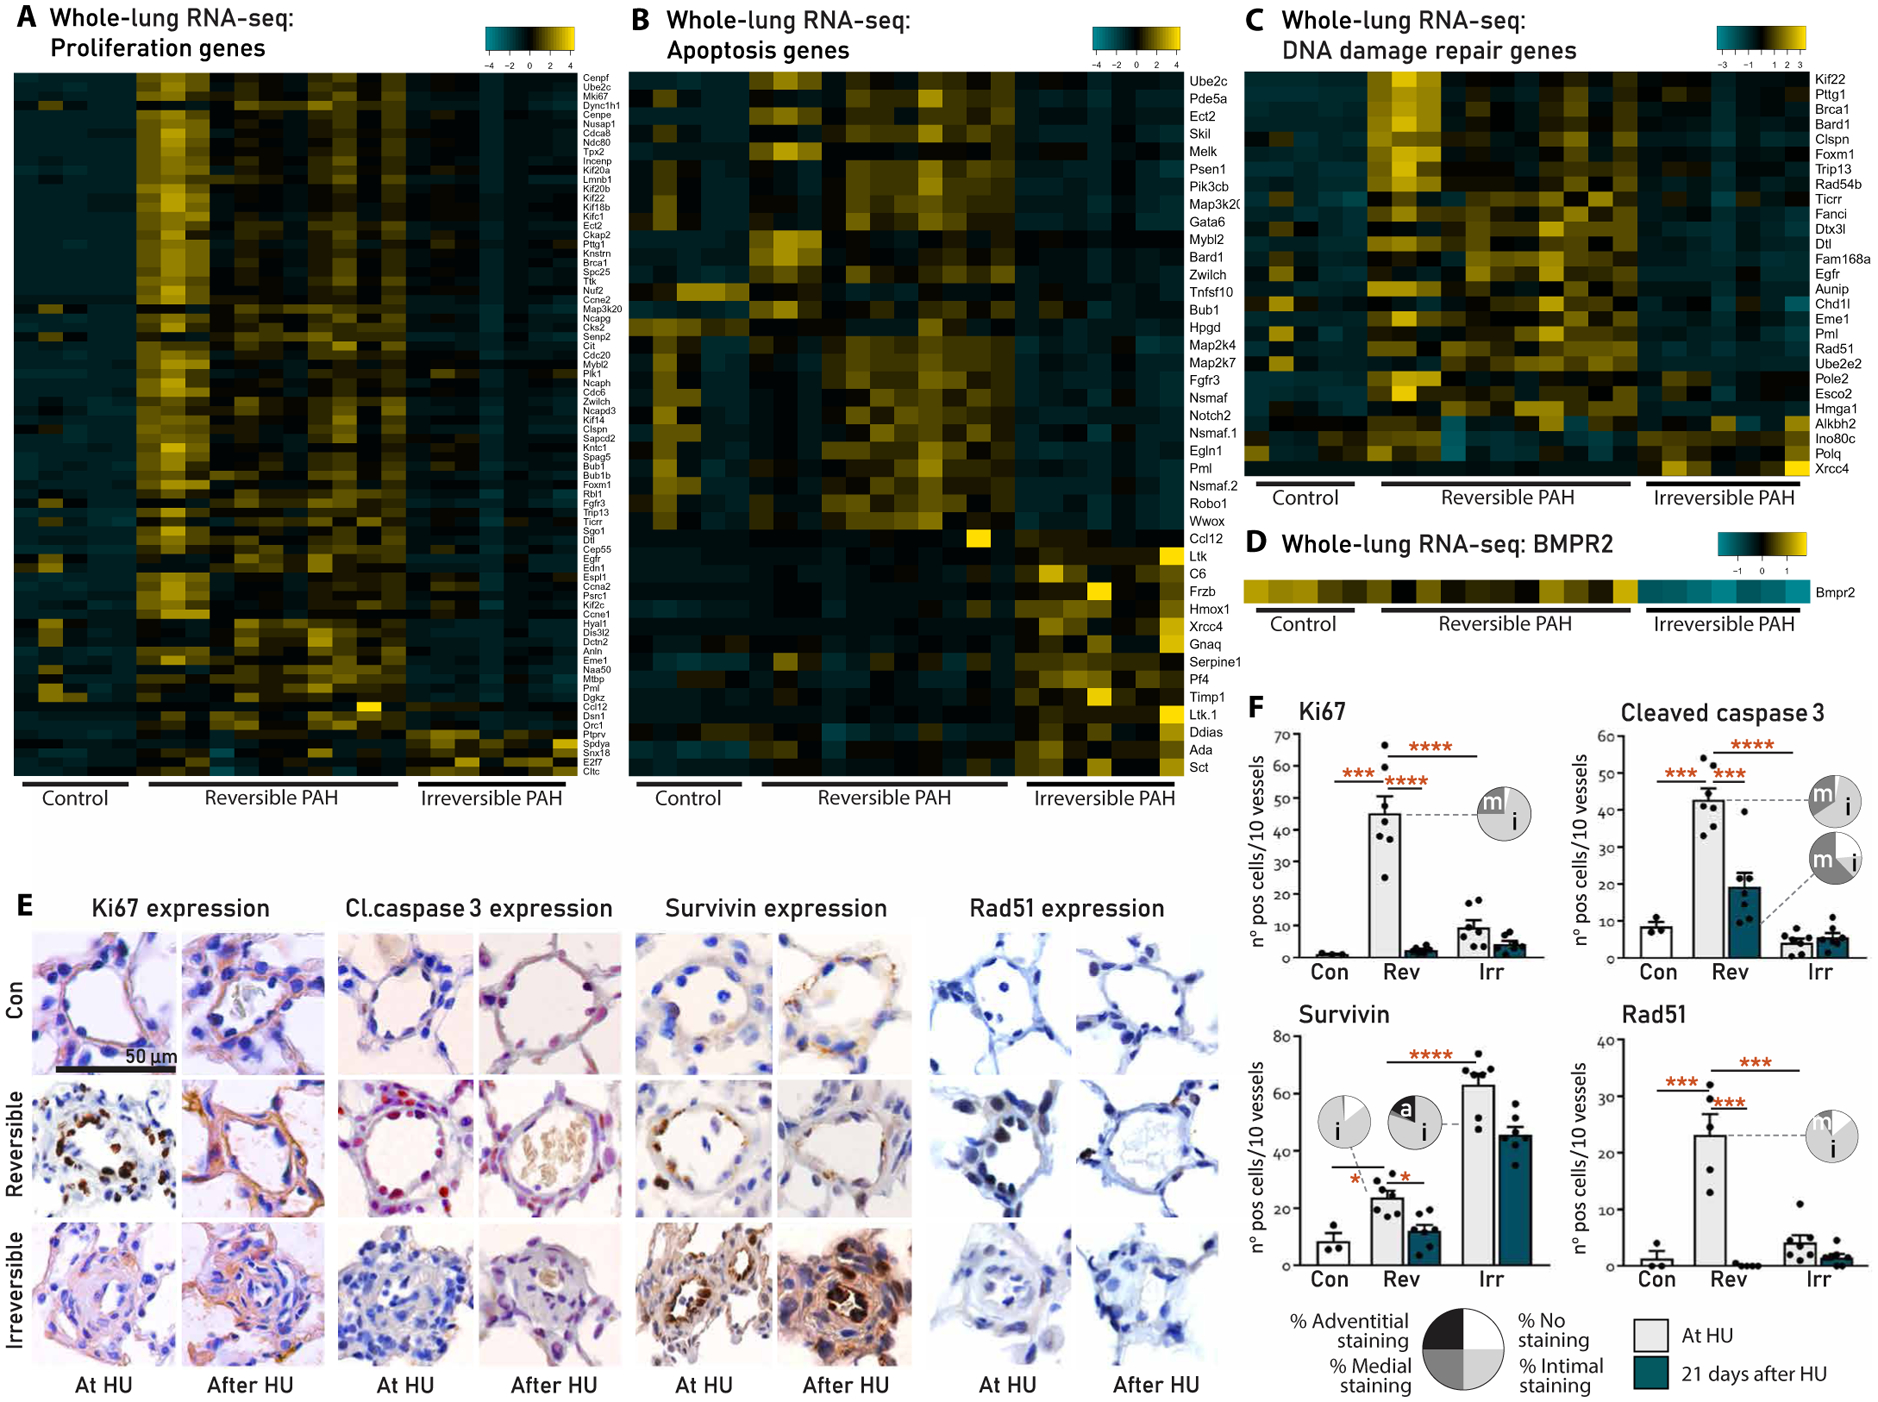
Fig. 3. Vascular profiles associated to the reversibility of PAH in MCT+shunt rats.

(A to D) Functional categorization of DEGs at q < 0.01 and >1log2FC cutoffs in lungs from controls and rats with reversible or irreversible PAH, made using the heatmap algorithm in R. (E) Representative immunohistochemistry of the intra-acinar vessels stained for Ki67, cleaved caspase 3, survivin, and Rad51 in lungs from controls and rats with reversible PAH and irreversible PAH at HU and 21 days after HU. (F) Quantification of vascular expression from (E). Black bars represent the expression at HU; green bars represent the expression 21 days after HU. Vascular localization of expression per group is represented in the pie charts [white, no expression; light gray, intima (i); dark gray, media (m); black, perivascular/adventitia (a)]. Con, n = 3; reversible, n = 7; irreversible, n = 7. Data are reported as means ± SD. Statistics by one-way ANOVA with Bonferroni correction or Kruskal-Wallis with Dunn’s correction. Relevant significant differences are indicated with a black bar and asterisk. *P < 0.05, **P < 0.01, ***P < 0.001, and ****P < 0.0001.
