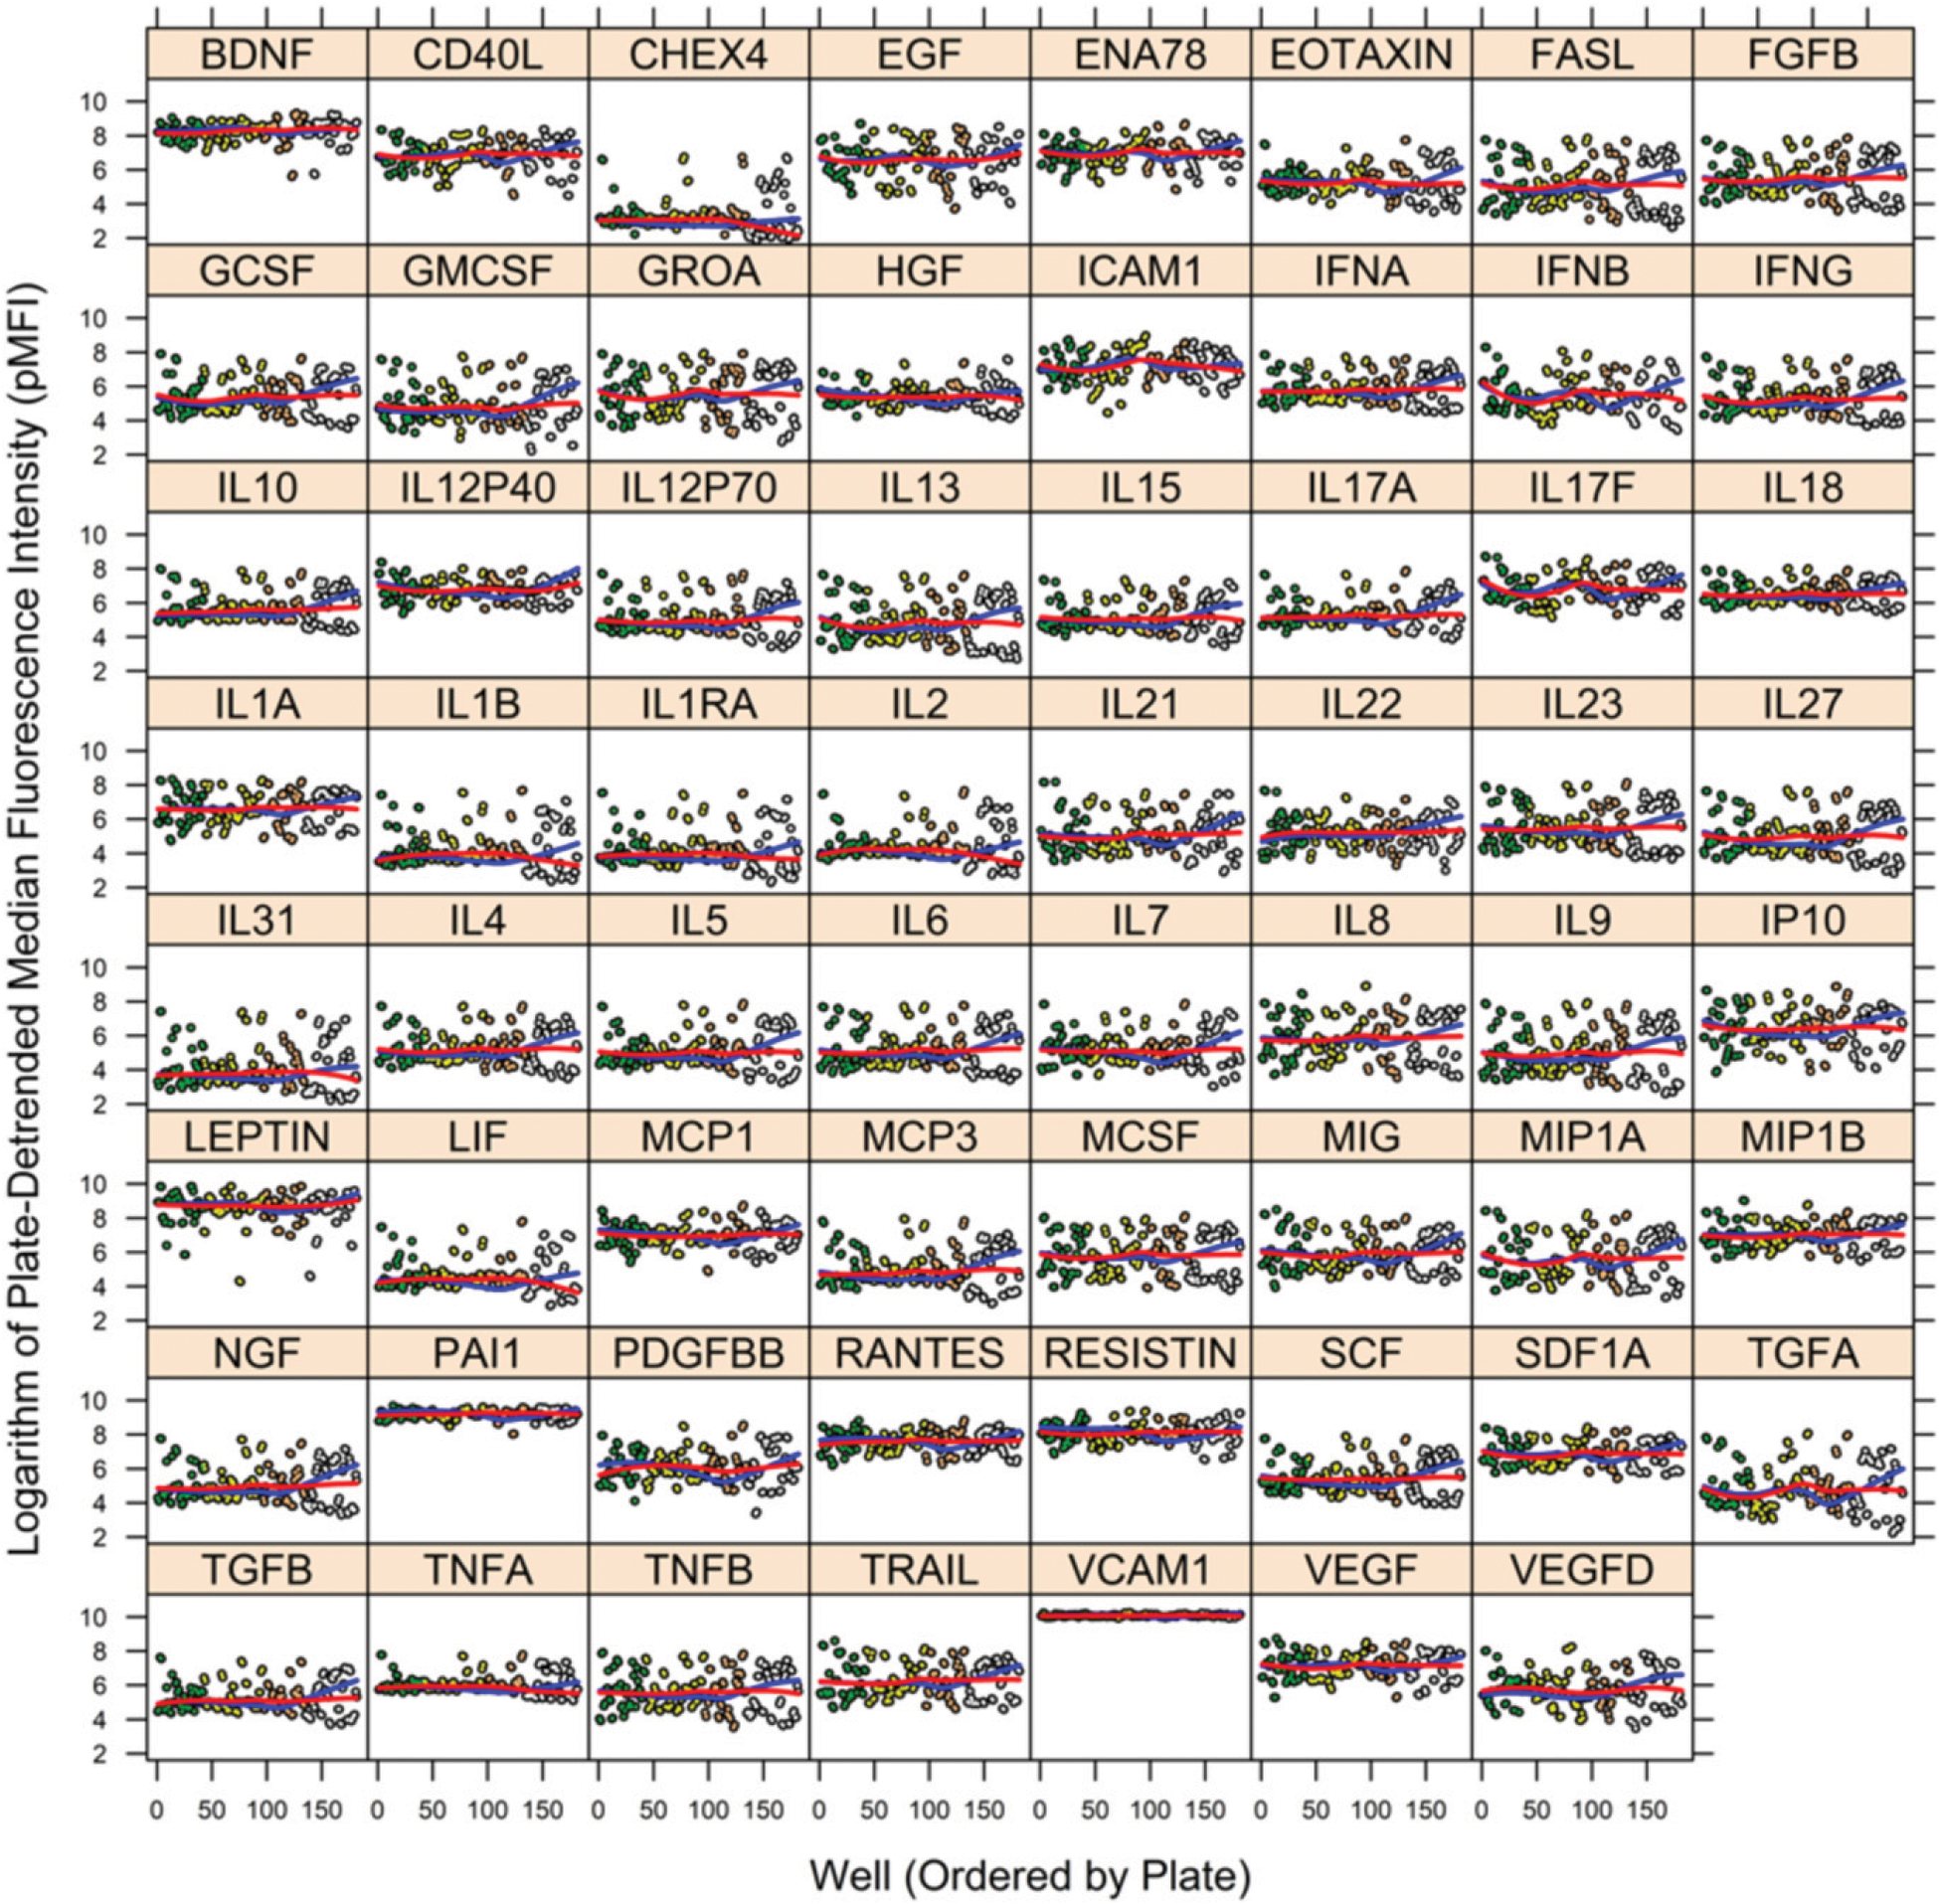
FIGURE 2.

MFI per well by cytokine after removal of plate artifact (pMFI) for PHAROS study. The vertical axis is MFI after removal of plate artifact (pMFI), and the horizontal axis is the ordering of wells (across plates). A separate figure is provided for each of the 62 cytokines plus the NC microbeads (labeled “CHEX4”). Color coding of circles distinguishes wells from different plates. Blue and red lines within each figure are spline smooths of trends in mean before and after removal of plate artifact, respectively. The largest adjustment was for the fourth plate (at right in each figure); although a few cytokines (TGFA) demonstrated adjustment in the third plate as well. Compare to the unprocessed data of Fig. 1. Figure was prepared in R package lattice (19).
