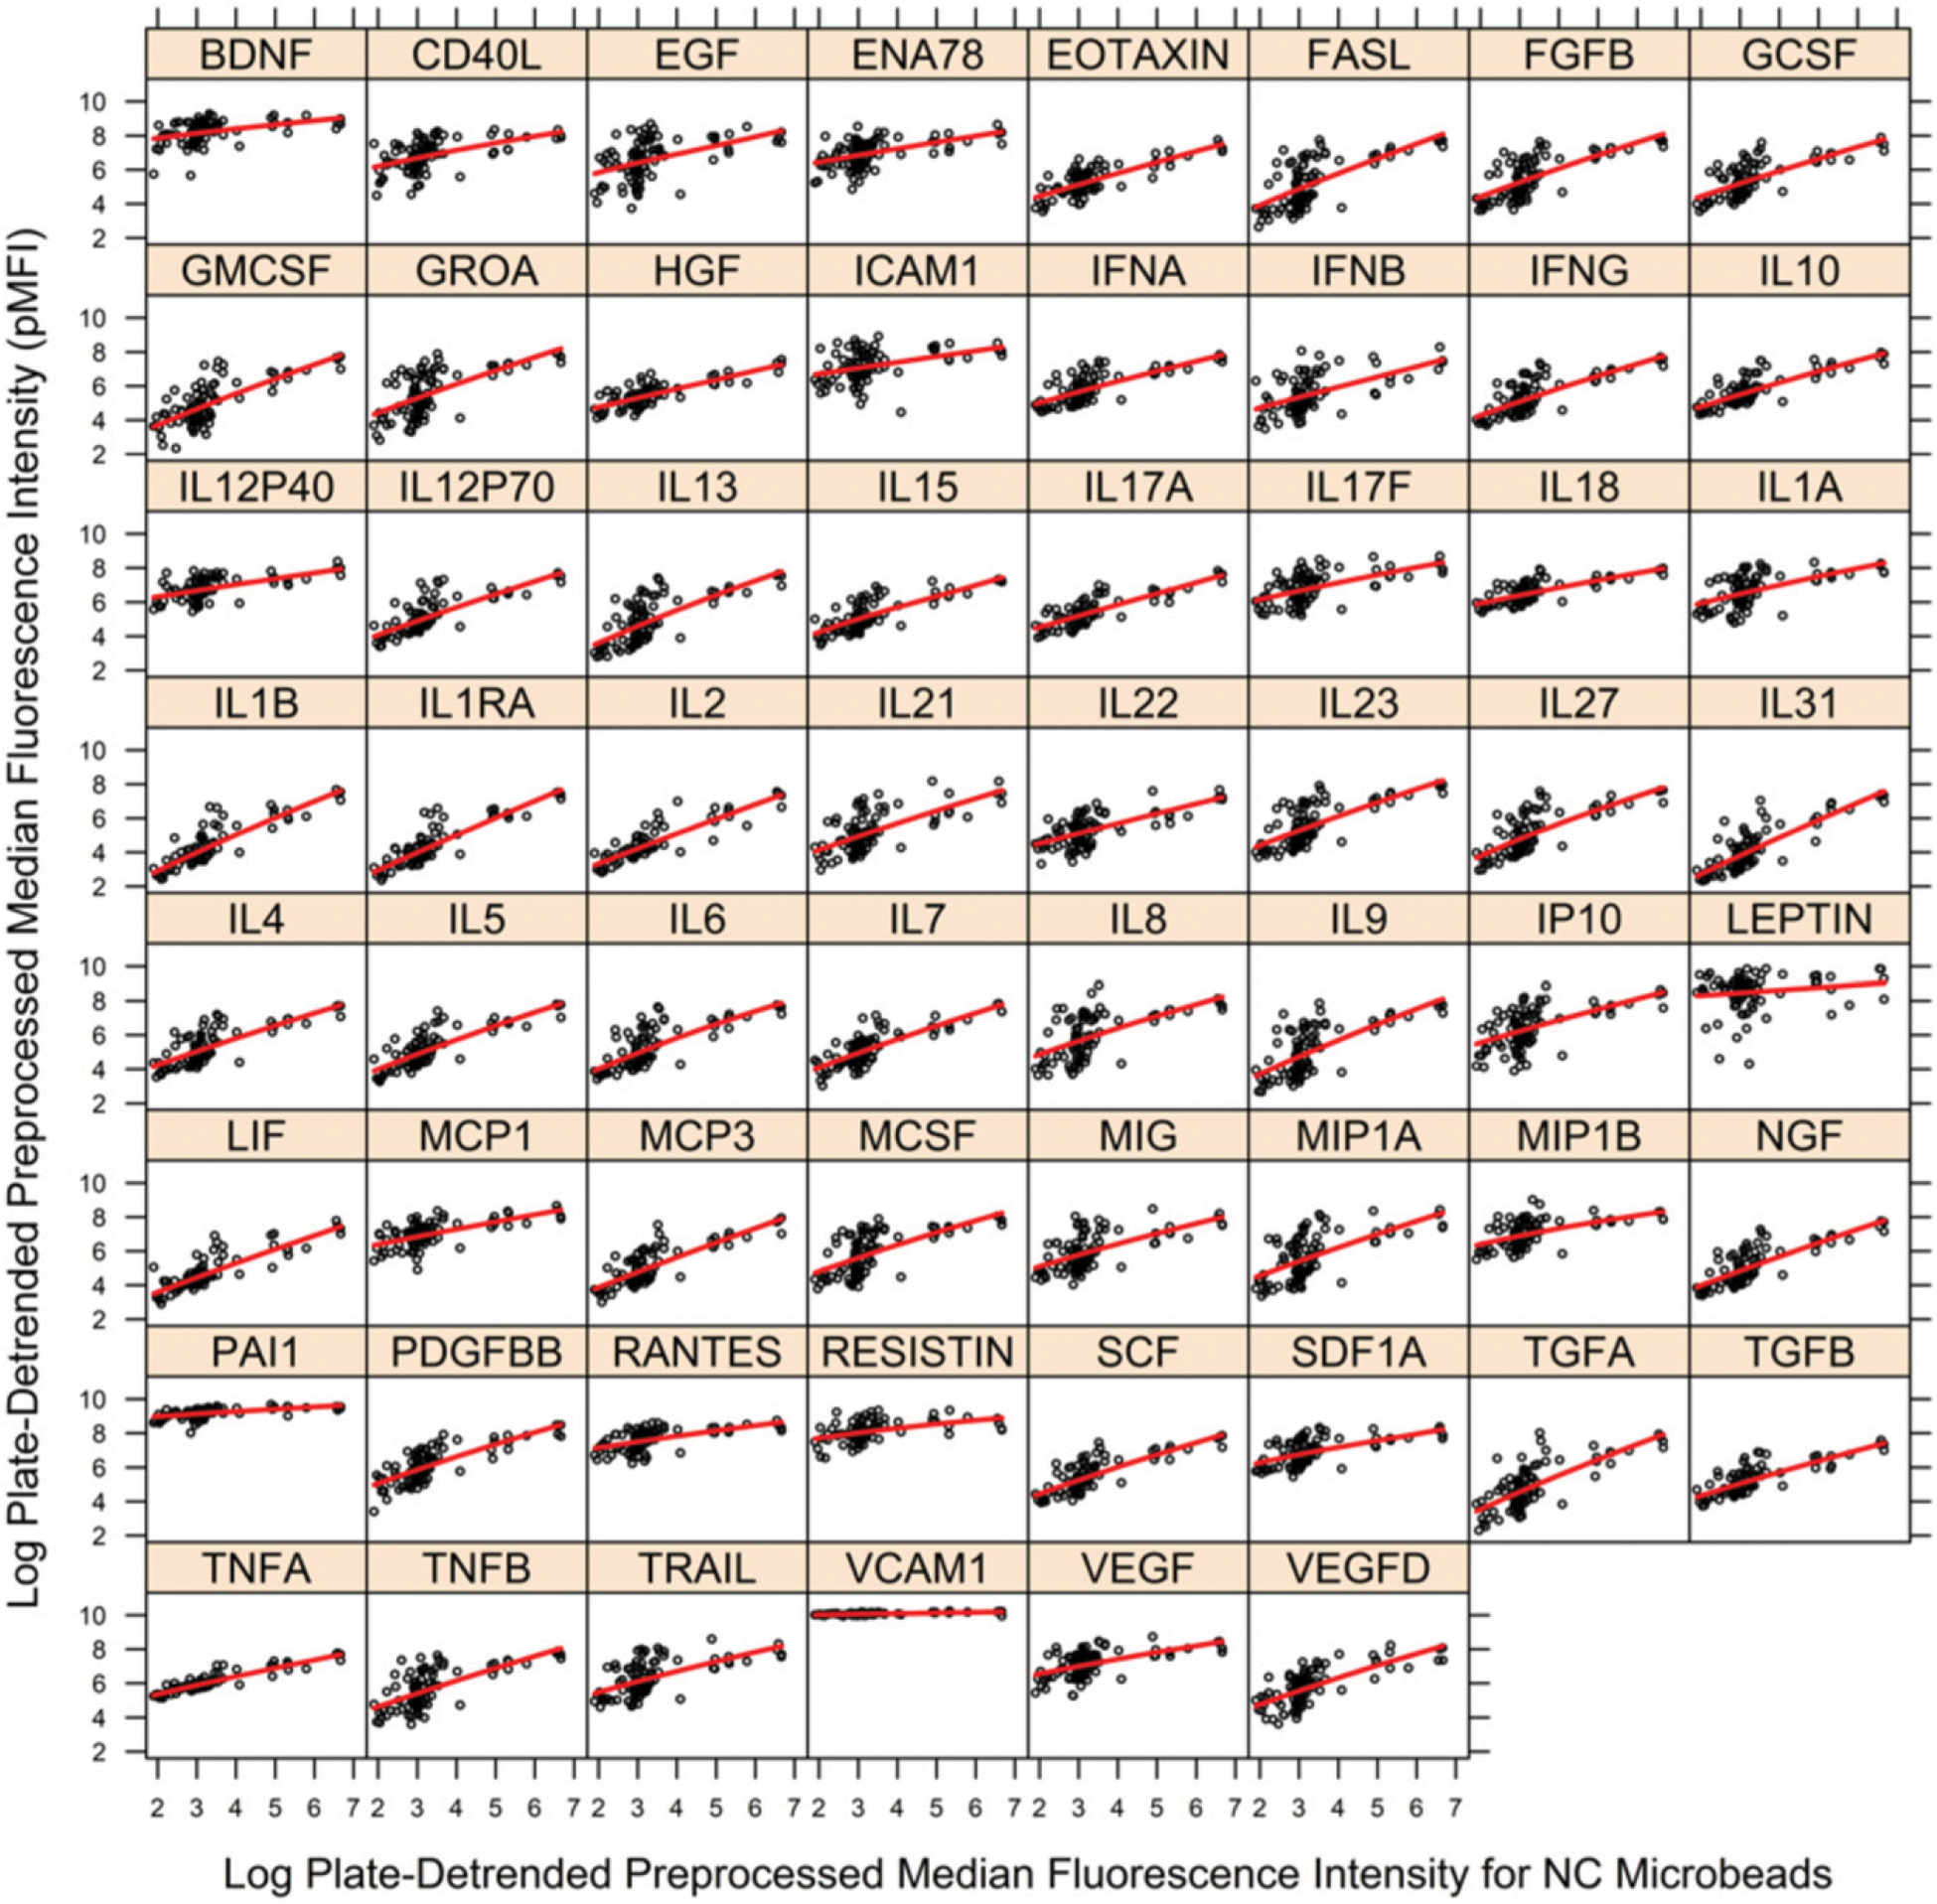
FIGURE 3.

Fit of regression model to pMFI data by cytokine for removal of nonspecific binding artifact for PHAROS study. Vertical axis is pMFI for cytokine, and horizontal axis is pMFI for NC microbeads (nonspecific binding). Black circles are observed pMFI data, and red line is estimated local, error-in-variables regression curve. A separate figure is provided for each of the 62 cytokines. The vertical departures of observed pMFI values (black) from the regression curve (red) are estimates of pMFI corrected for nonspecific binding (dpMFI) where dpMFI is shown in Fig. 4. The large gaps in the sample distribution of NC pMFI values ≥4 necessitated assessment of large bandwidths for the local regression estimator. Figure was prepared in R package lattice (19).
