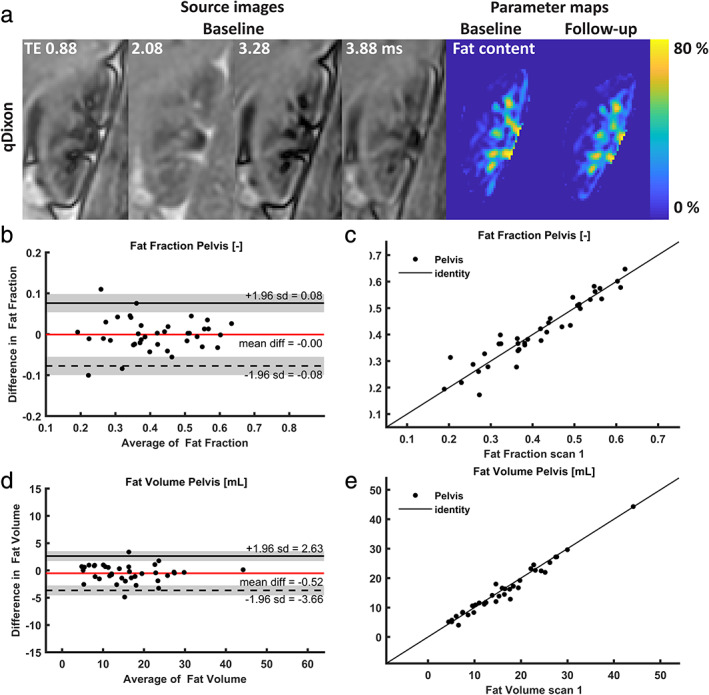
FIGURE 7.

(a)Source images and parameter maps of the quantitative Dixon; (b–e) Bland–Altman plots and scatterplots for (b): pelvic fat fraction; (c) scatterplot for pelvic fat fraction; (d) pelvic fat volume; (e) scatterplot for pelvic fat volume. qDixon: quantitative Dixon.
