FIGURE 5.

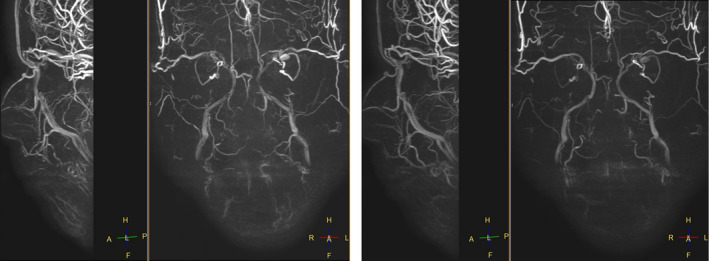
3D PC MRA: a lot of venous interference with low speed factor selection (Right Venc 5) and less obvious visualization of low flow speed arteries at higher speed factor selection (Left Venc 10)

3D PC MRA: a lot of venous interference with low speed factor selection (Right Venc 5) and less obvious visualization of low flow speed arteries at higher speed factor selection (Left Venc 10)