
Figure 1.
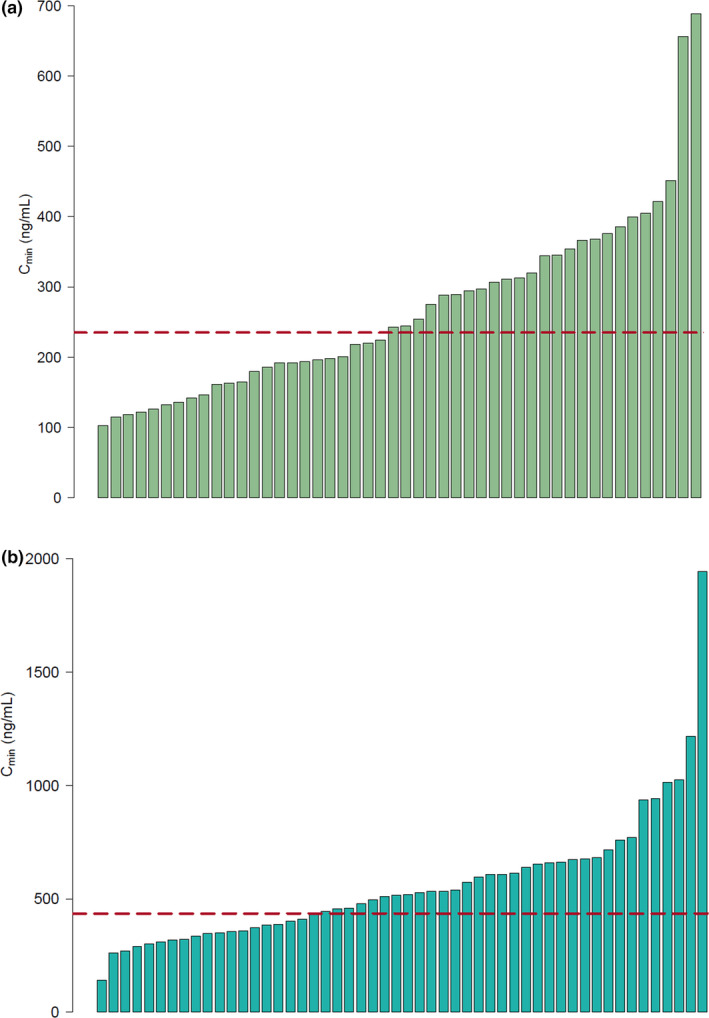
Bar plots of median crizotinib and alectinib Cmin per patient. (a) Median crizotinib Cmin per patient. Each bar represents one patient. The dotted line indicates the threshold of 235 ng/mL. Twenty‐three patients (48%) have a pharmacokinetic exposure below this threshold. Interindividual and intraindividual variability were 45% and 20%, respectively. (b) Median alectinib Cmin per patient. Each bar represents one patient. The dotted line indicates the threshold of 435 ng/mL. Nineteen patients (37%) have a pharmacokinetic exposure below this threshold. Interindividual and intraindividual variability were 57% and 27%, respectively. Cmin, minimum plasma concentration. [Colour figure can be viewed at wileyonlinelibrary.com]