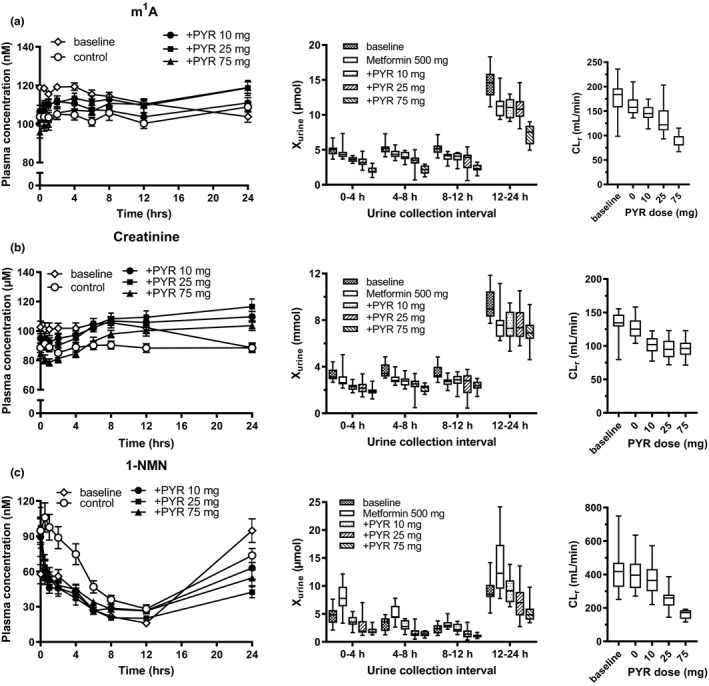
Figure 2.

Effect of pyrimethamine on the plasma concentration‐time profiles and amount excreted into the urine and CLr of endogenous OCT2/MATE substrates. Plasma concentrations of m1A (a), creatinine (b), and 1‐NMN (c) were determined at designated times in healthy volunteers in the baseline phase, and drug treatment phases (metformin with or without an oral dose of pyrimethamine 10, 25, and 75 mg). Each symbol represents the mean and SEM (n = 12). Amounts excreted into the urine during the intervals designated and CLr were shown in box‐and‐whisker plot. m1A, N 1‐methyladenosine; 1‐NMN, N 1‐methylnicotinamide; +PYR, pyrimethamine administration; CLr, renal clearance.
