
Figure 4.
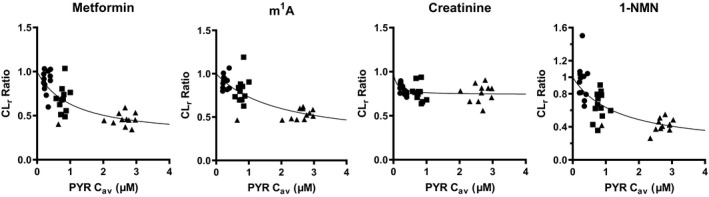
Nonlinear regression analysis CLr ratio of the test compounds and pyrimethamine C av. Ki ,app of pyrimethamine with regard to C av, and f PYR were determined by iterative nonlinear regression analysis, as described in Methods. Rigid lines represent the fitted lines. The fitted parameters were summarized in Table 2 . 1‐NMN, N 1‐methylnicotinamide; Cav, mean plasma concentration; CLr, renal clearance; f PYR, fraction sensitive to inhibition by pyrimethamine; K i,app, apparent inhibition constant of pyrimethamine as the total concentration; PYR, pyrimethamine.