
Figure 5.
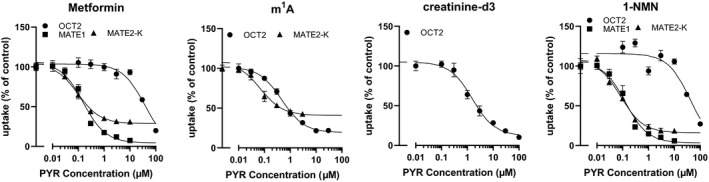
Effect of pyrimethamine on OCT2, MATE1, and MATE2‐K. Uptake of metformin (10 μM), m1A (100 μM), creatinine‐d3 (100 μM), and 1‐NMN (10 μM) was determined in the presence of pyrimethamine at various concentration in the stable expression system of OCT2, MATE1, and MATE2‐K using HEK293 cells. Incubation time was 2 minutes except for m1A (30 minutes) to determine the uptake. Absolute values of the uptake are summarized in Table S3 . Each symbol represents the mean and SEM (n = 3). Rigid lines represent the fitted line. Nonlinear regression analysis was conducted as described in Supplementary Methods . 1‐NMN, N 1‐methylnicotinamide; m1A, N 1‐methyladenosine; PYR, pyrimethamine.