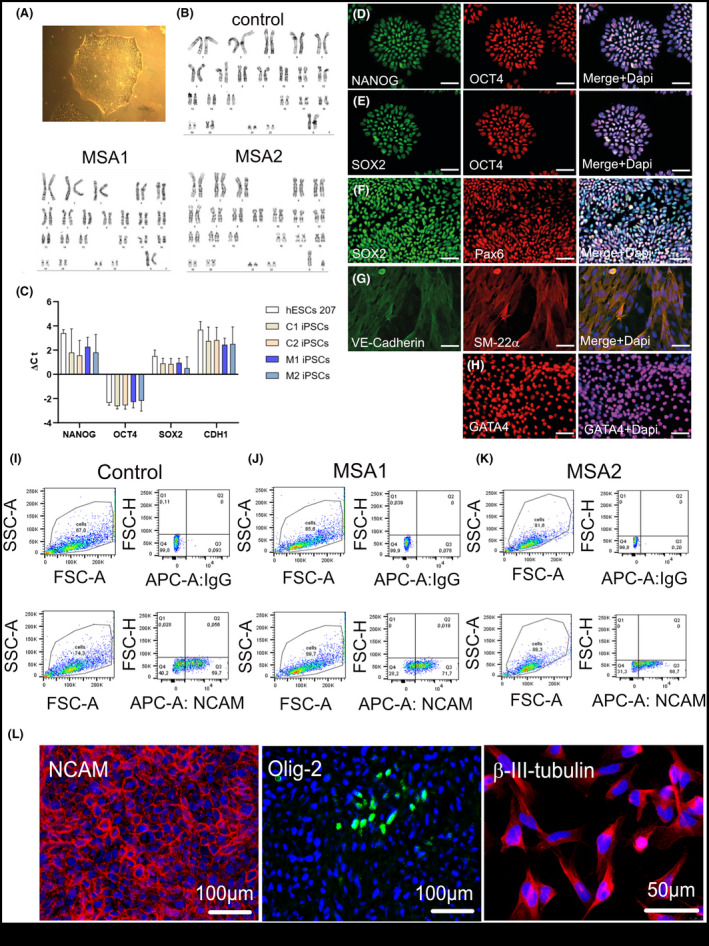
Figure 1.

Generation and characterization of iPSCs and NPCs. (A) iPSCs colony of a validated MSA1 line (B) Representative karyotypes of iPSC lines. (C) Histogram depicting the ΔCt of pluripotent genes iPSC lines (C = control; M = MSA; hESC, human embryonic stem cells used as a reference)). Data are presented as Mean ± SD. (D, E) Expression of pluripotency markers NANOG, OCT4 and SOX2 in the generated iPSCs. (F) Ectoderm differentiation of iPSCs and PAX6 expression. (G) Mesoderm differentiation of iPSCs and VE‐Cadherin and SM22α expression. (H) Endoderm differentiation of iPSCs and GATA4 expression. Scale bars 100 µm. (I‐K) FACS plots demonstrating the sorted NCAM‐positive NPCs of control and MSA lines with the respective IgG control. These NPCs were used for the following experiments. (L) Expression of NCAM, Olig‐2, and β‐III‐tubulin in sorted NCAM‐positive NPCs. Counterstaining with DAPI (blue)
