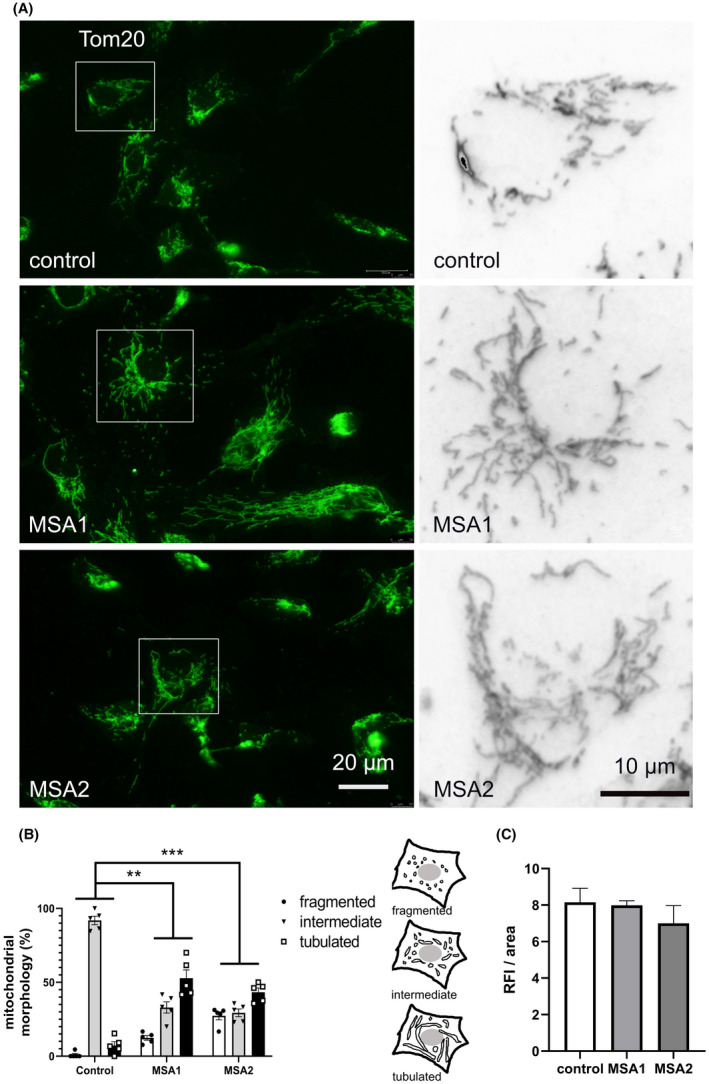
Figure 2.

Shift of the mitochondrial morphology in MSA NPCs. (A) Mitochondria were visualized with Tom20 immunofluorescence in control and MSA‐derived NPCs. Insets are shown at higher magnification on the right. (B) The mitochondrial morphology was scored as previously described [42] in five samples per line: fragmented – mainly short and round; intermediate – round and short tubulated; tubular – long with higher connectivity. Data are presented as mean ± SEM. Two‐way ANOVA with Tukey’s posthoc correction for multiple comparison. **P < 0.01; ***P < 0.001. (C) The amount of mitochondria per cell was estimated by measuring the relative fluorescence intensity (RFI) per cell area using ImageJ. Data are presented as mean ± SEM. One‐way ANOVA comparison between the groups showed no significant differences (P = 0.578)
