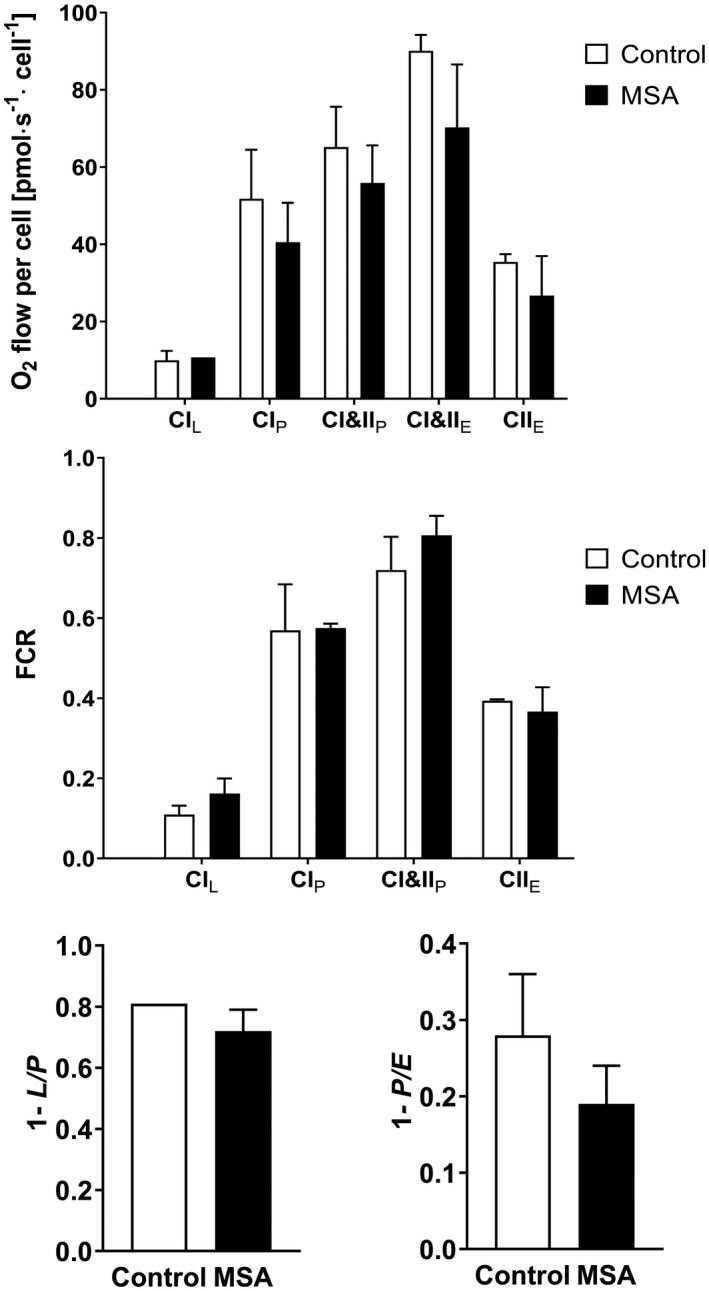
Figure 3.

High resolution respirometry of MSA and control NPCs. (A) Absolute oxygen consumption per cell of control and MSA NPCs including CI‐linked (CIL) LEAK state after addition of CI substrate without ADP; CI‐linked (CIP) and CI&II‐linked (CI&IIP) OXPHOS capacity as well as CI&II‐linked (CI&IIE) electron transfer system (ETS) capacity and CII‐linked ETS capacity after addition of an uncoupler (CIIE). (B) Flux control ratios (FCR) for all respiratory states referenced to CI&IIE ETS capacity. (C) Flux control factor (FCF) representing the OXPHOS coupling efficiency (1‐L/P); (D) FCF representing the excess of ETS capacity (1‐P/E). Data are presented as mean ± range. No group differences were observed between the single parameters by two‐way ANOVA or t‐test
