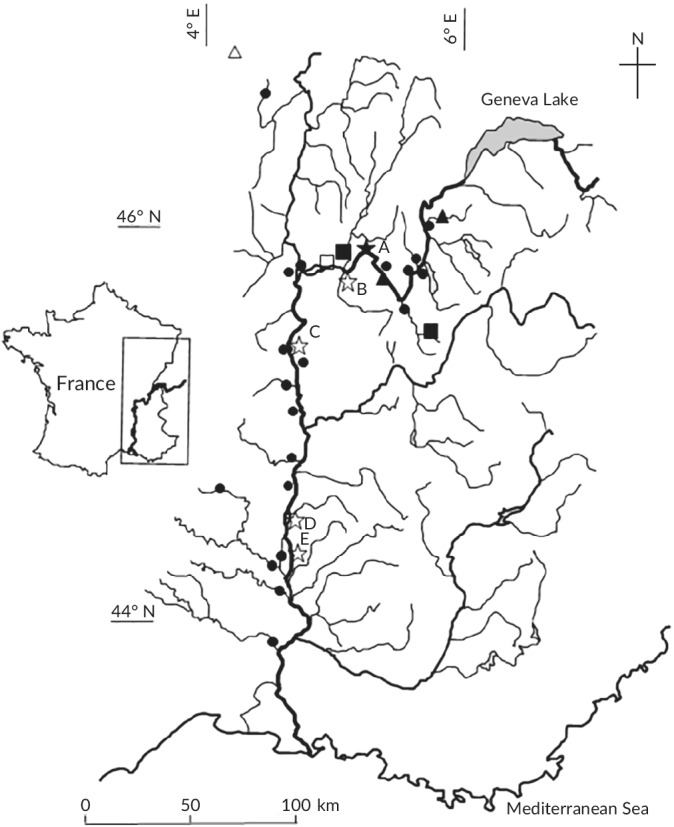
FIGURE 1.

Sampling locations along river stretches (RS) A to E ( ) of the main channel of the Rhône River, France, using both traditional electro‐fishing (TEF) and eDNA.
  , Sites sampled every 2 months (September 2015– August 2016);
  , sites where ten eDNA water samples (filtration capsules) were collected once;
  , sites located on the tributaries or the Rhône River itself sampled once for eDNA. The 10 metric fish index and the adapted six‐metric fish index were computed at all sites with a black filled symbol within natural water bodies
