
FIGURE 2.
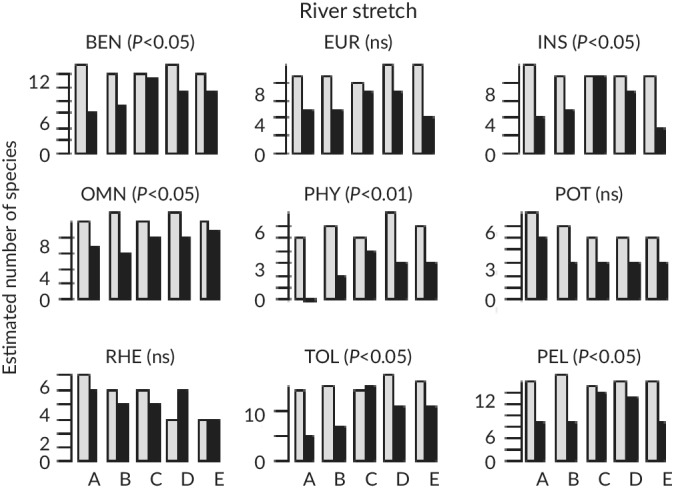
Comparison of trait‐based metrics expressed in number of species computed from eDNA ( ) and traditional electro‐fishing (TEF;
  ) samples in the five river stretches (RS), A, B, C, D and E. Trait categories: BEN, benthic; EUR, eurytopic; INS, insectivorous; OMN, omnivorous; PHY, phytophilic; POT, potamodromous; RHE, rheophilic; TOL, tolerant; PEL pelagic. Significance of the differences between eDNA and TEF metrics are shown: P < 0.05; P < 0.01; ns, not significant (P > 0.05)