FIGURE 1.

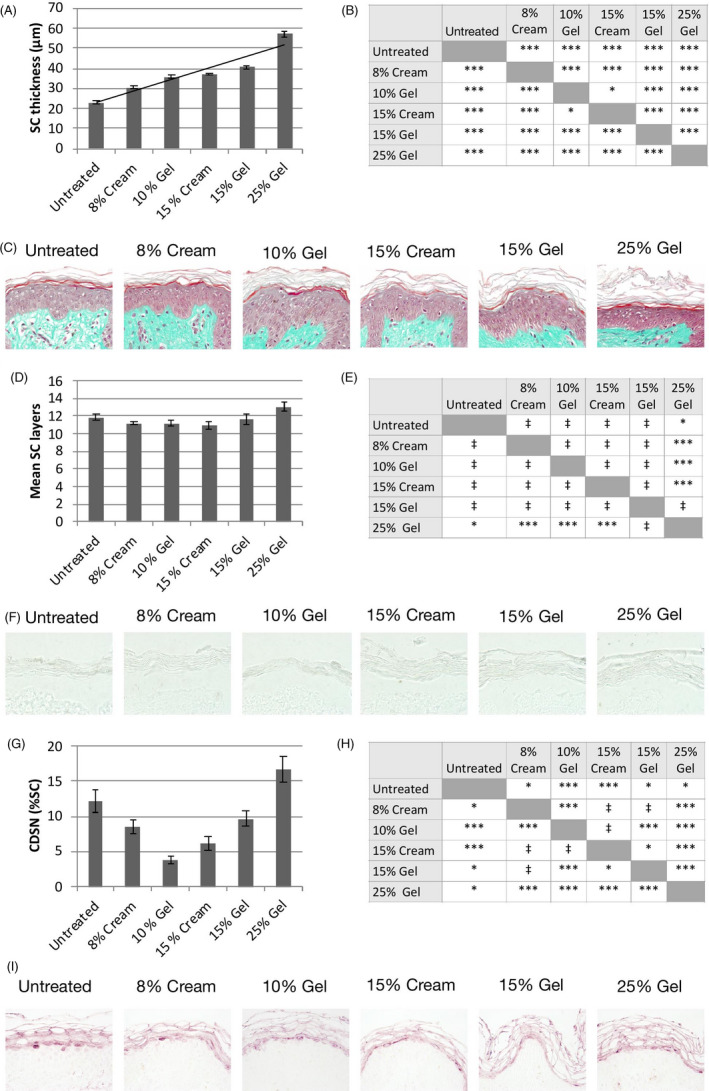
Effect on the stratum corneum. A, Thickness of the stratum corneum (SC) on day 6. Data show mean ± SEM of 27 images. B, Statistical comparisons between treatment groups; ***P < .01; *P < .05. C, Representative skin sections stained with Masson‐Goldner trichrome stain on day 6. D, Number of corneocyte layers on day 6. Data show mean ± SEM of 27 images. E, Statistical comparisons between treatment groups; ***P < .01; *P < .05; ‡ not significant. F, Representative skin sections following treatment with 0.4 N NaOH. G, Corneodesmosin (CDSN) expression levels on day 6. Data show mean ± SEM of 9 images per condition. H, Statistical comparisons between treatment groups; ***P < .01; *P < .05; ‡ not significant. I, Representative skin sections stained with a polyclonal anti‐CDSN antibody on day 6
