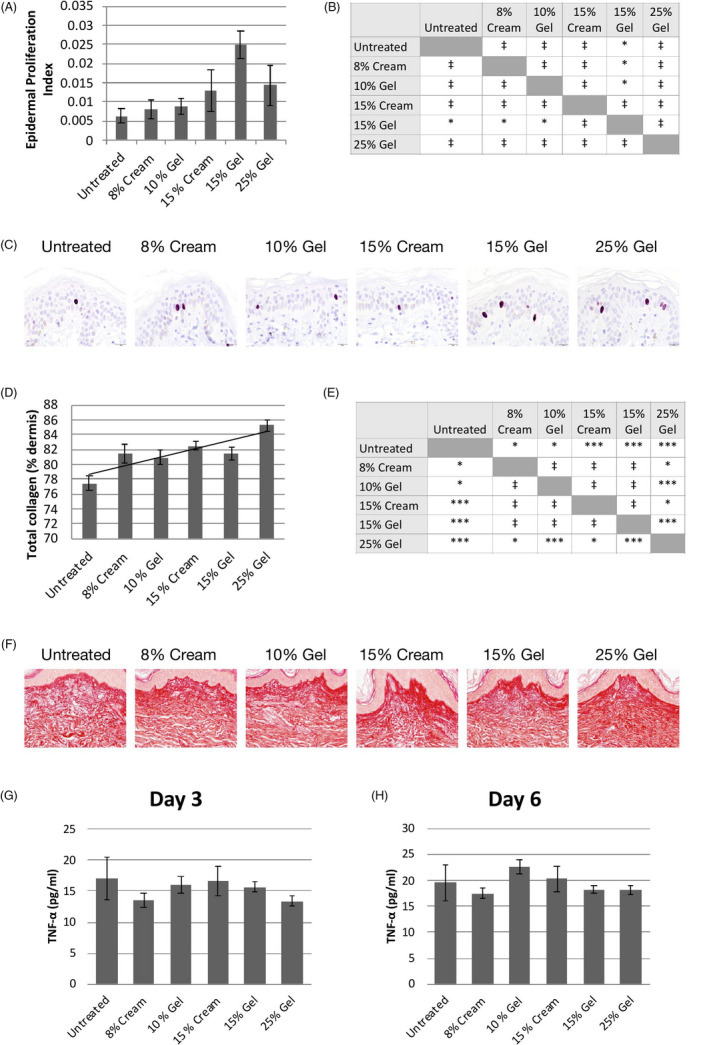
FIGURE 2.

Effect on keratinocyte proliferation, total collagen, and TNF‐α levels. A, Epidermal Proliferation Index on day 6. Data show mean ± SEM of 3 explants. B, Statistical comparisons between treatment groups; *P < .05; ‡ not significant. C, Representative skin sections stained for Ki‐67. D, Total collagen levels on day 6. Data show mean ± SEM of 9 images per condition. A trend line is shown. E, Statistical comparisons between treatment groups; ***P < .01; *P < .05; ‡ not significant. F, Representative skin sections stained with Sirius red on day 6. TNF‐α levels on day 3 (G) and day 6 (H). Data show mean ± SEM of 4 replicates per condition. All comparisons are not significant
