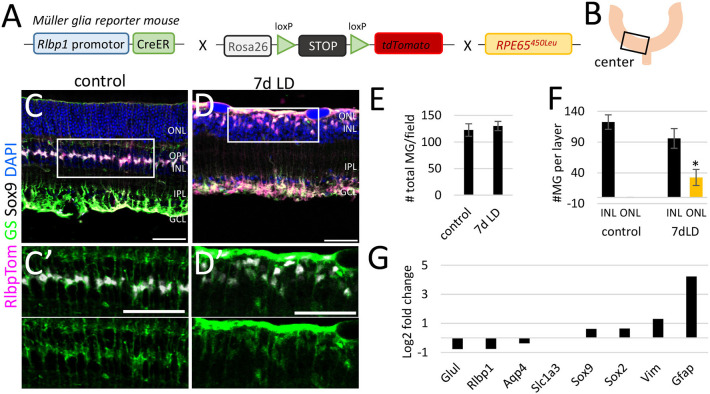
Figure 2.
Müller glia number and location in the central retina after light damage. (A) Schematic of the RlbpCreER: stopf/f-tdTomato: RPE65450Leu mouse. (B) Region of analysis. (C/C′,D/D′) Immunofluorescence labeling for tdTomato (MG), glutamine synthetase (GS), Sox9, and DAPI nuclear staining of retinal sections from undamaged controls and 7 days after light damage. (E) Number of MG per field in undamaged mice and 7 days after light damage (LD). (F) Number of MG in the INL and ONL in undamaged controls and 7 days after LD. (G) Expression levels (log2 fold change light damage vs. control) of glial genes in undamaged (6 biological replicates, one technical replicate) and damaged retinas (five biological replicates, one technical replicate). Scale bars 50 μm. Significant differences are indicated: *p < 0.05, Wilcoxon-test, n control = 5, n LD = 5. ONL: outer nuclear layer; OPL, outer plexiform layer; INL, inner nuclear layer; IPL, inner plexiform layer; GCL, ganglion cell layer; LD, light damage.

