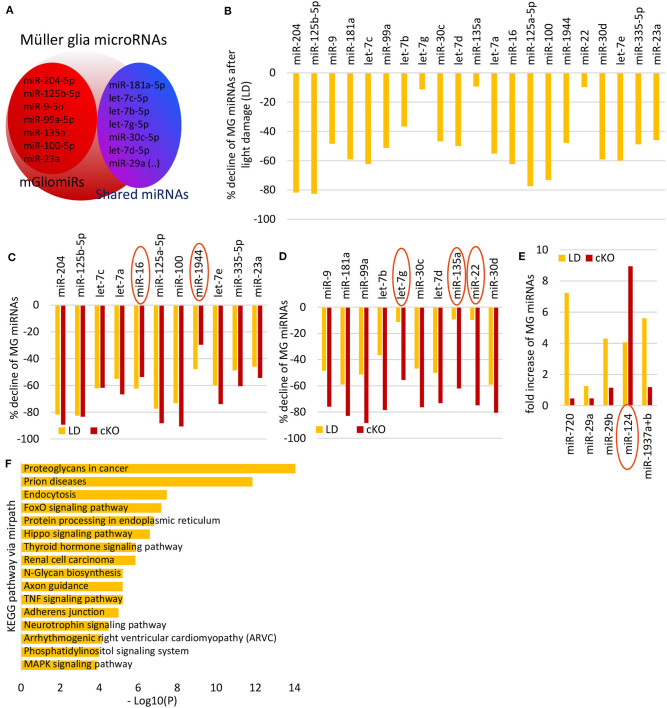
Figure 3.
Müller glia miRNA expression after light damage. (A) Schematic of miRNA highly expressed in MG i.e., mGliomiRs and shared miRs (modified after Wohl and Reh, 2016). (B) Percent decline of the top 21 highly expressed MG miRNAs after 7 days light damage compared to normal MG (cutoff 3,000 counts). (C) miRNAs with similar declined levels after light damage as after Dicer deletion (in percent). (D) miRNAs with less declined levels after light damage as after Dicer deletion (in percent). (E) Fold increase of 5 miRNAs that increased after 7 days light damage (cutoff 5,000 counts) compared to controls. (F) DIANA-mirPath v.3 analysis of the 21 MG miRNAs that declined after light damage.

