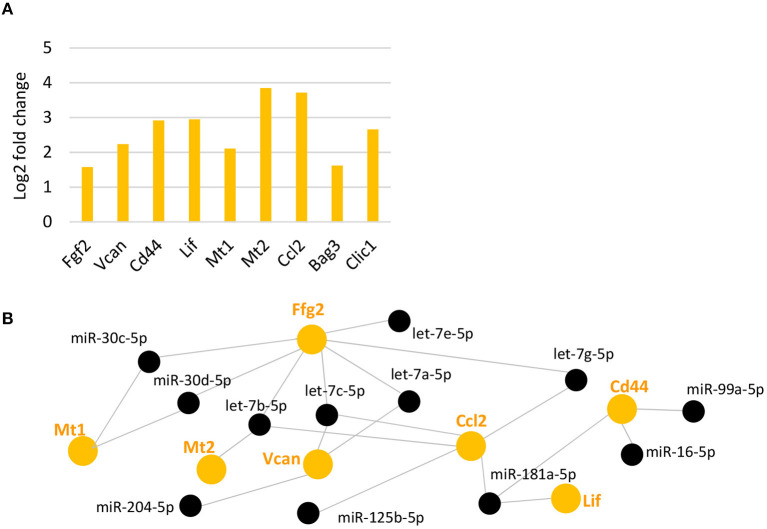
Figure 5.
Upregulated reported genes after light damage and their potential miRNA regulators. (A) Expression levels (fold change of log2 relative expression) of reported genes upregulated after light damage compared to undamaged controls (five and six biological replicates, respectively, one technical replicate per condition). (B): DIANA-TarBase analysis of genes in A and MG miRNAs that declined and are likely to target these genes based on prediction and experimental confirmation. FDR, false discovery rate.

