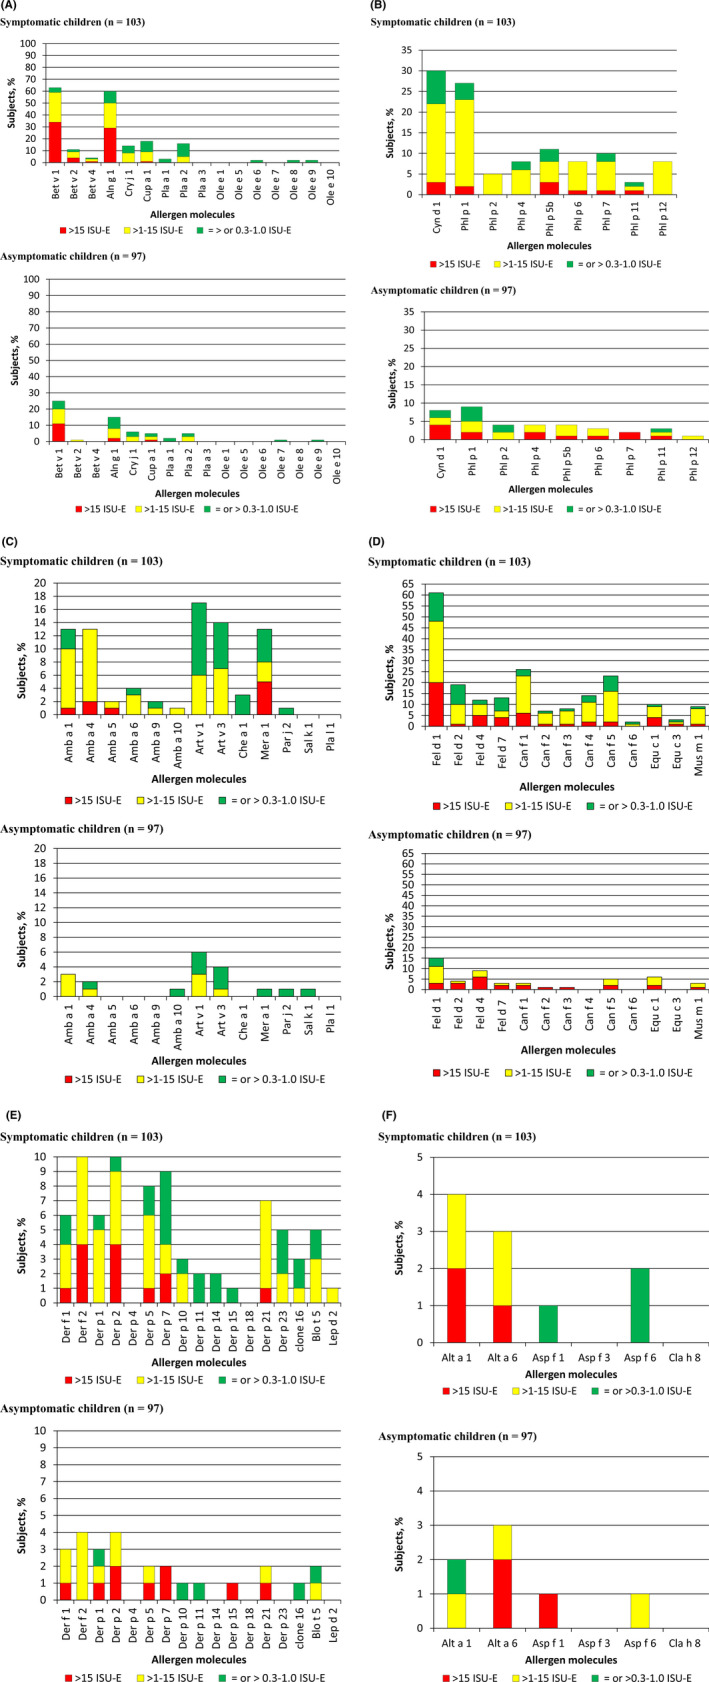
FIGURE 4.

Percentages and levels of specific IgE (y‐axes) among children with (upper part) and children without symptoms of allergy (lower part) for tree pollen allergens (A), grass pollen allergens (B), weed pollen allergens (C), animal dander allergens (D), house dust mite allergens (E), and mold allergens (F). Allergen molecules (x‐axes) [Colour figure can be viewed at wileyonlinelibrary.com]
