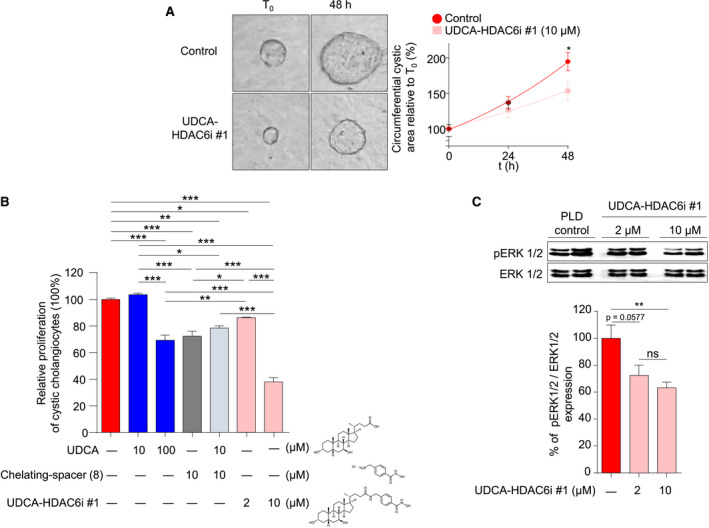
FIG. 6.

Effect of UDCA‐HDAC6i #1 on proliferation of 2D‐ and 3D‐cultured PLD cholangiocytes. (A) 3D culture in collagen type I of bile ducts/cysts isolated from PCK rats. Representative images and graph representing the relative circumferential area of nontreated (n = 20) and UDCA‐HDAC6i #1–treated (n = 20; 10 µM) cystic cholangioids along time. (B) Proliferation of PLD cholangiocytes by flow cytometry. Bar graph represents the percentage of cell proliferation after 48 hours of treatment with 10 µM of UDCA (n = 7), 100 µM of UDCA (n = 22), 2 µM of UDCA‐HDAC6i #1 (n = 16), 10 µM of UDCA‐HDAC6i #1 (n = 23), 10 µM of spacer chelating component (8) (n = 23), or combined treatment with 10 µM of UDCA + 10 µM of spacer chelating component (8) (n = 7) relative to control PLD cholangiocytes (n = 23) without treatment. (C) Representative immunoblotting of phosphorylated and total ERK1/2 protein levels from cell lysates of nontreated and UDCA‐HDAC6i #1–treated PLD cholangiocytes. Graph represents the relative abundance of phosphorylated ERK1/2 in baseline (n = 5) and 2 µM (n = 5) or 10 µM (n = 5) of UDCA‐HDAC6i #1–treated PLD cholangiocytes using total ERK as normalizing control. In all cases, a statistical unpaired two‐tailed t test was applied to determine significance. Abbreviation: ns, not significant.
