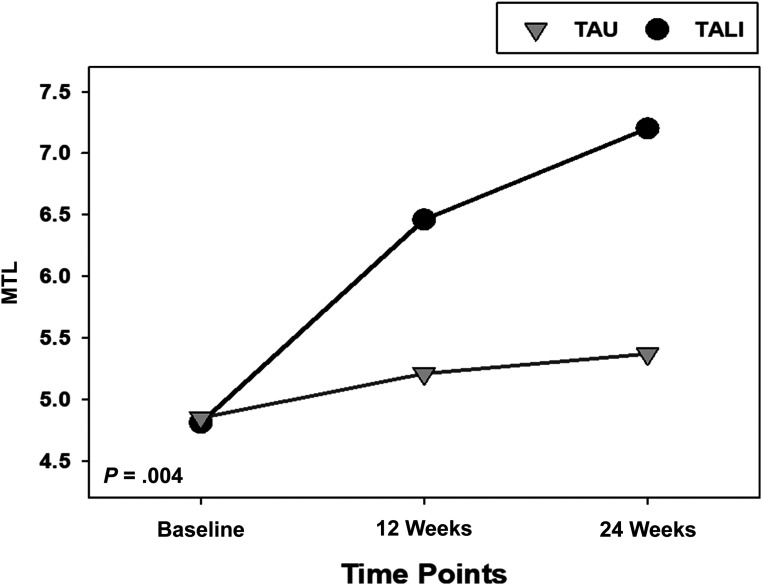
FIGURE 4.
Change in MTL during the study period for children randomly assigned to the TALI and children randomly assigned to the TAU group. Group by time interaction was statistically significant in the model (P = .004), indicating that the trajectories for the 2 groups were statistically different.

