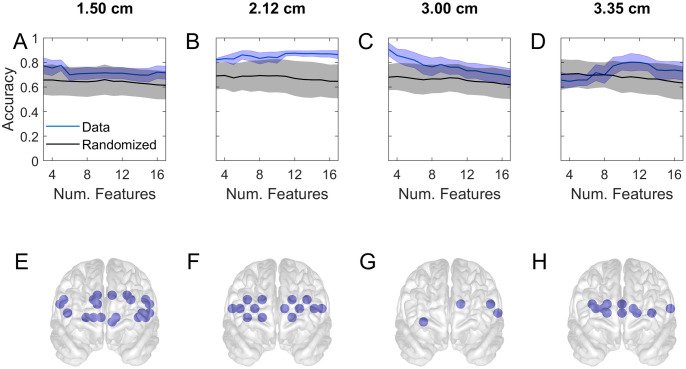
Fig 6. Accuracy of classification of the NASA-TLX score of student subjects in task 1.
The scores were segregated into sets of high and low values by using the median score as cut-off and predicted based on prefrontal activations by using support vector machine. A-D show the accuracy as a function of the number of channels used. The thick curves are the mean of 2000 repetitions of different 5-fold cross-validations. The shaded region indicates the standard deviation of the variability in the accuracy. The results (blue curve) are compared with those from a surrogate set that contained the same data but the scores were randomly reassigned prior to classification (black). E-H show the frontal view locations of selected channels that resulted in high accuracy.

