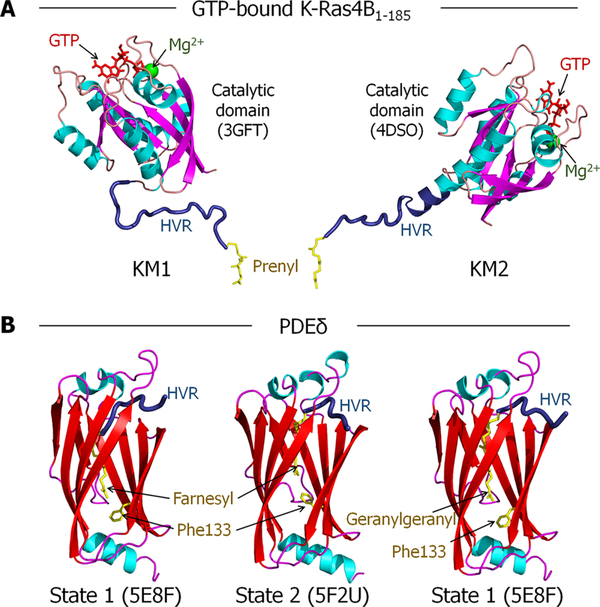
Figure 1.
Crystal structures used to model the K-Ras4B-GTP/PDEδ interaction. (A) Two K-Ras4B-GTP models (KM1 and KM2) constructed for modeling the K-Ras4B-GTP/PDEδ complex. Two crystal structures of the K-Ras4B catalytic domain (PDB ID: 3GFT and 4DSO) were used. The GTP analogues in the crystal structures were converted to GTP (red). The missing HVR (dark blue) coordinates were modeled as a flexible loop. The prenyl (yellow) and methyl groups were added to Cys185, at the C-terminus. (B) PDEδ models used for modeling the K-Ras4B-GTP/PDEδ complex. To model the interactions of PDEδ with farnesyl and geranylgeranyl moieties, two crystal structures were used (PDB ID: 5F2U and 5E8F). The former PDEδ crystal structure contained the farnesyl group in the hydrophobic cavity, and the latter involved the geranylgeranyl group in the cavity. Depending on the orientations of the Phe133 side chain resulting from the deep/shallow insertion of the prenyl groups, we designated PDEδ into two different states; state 1 is for the downward side chain, and state 2 is for the upward side chain.

