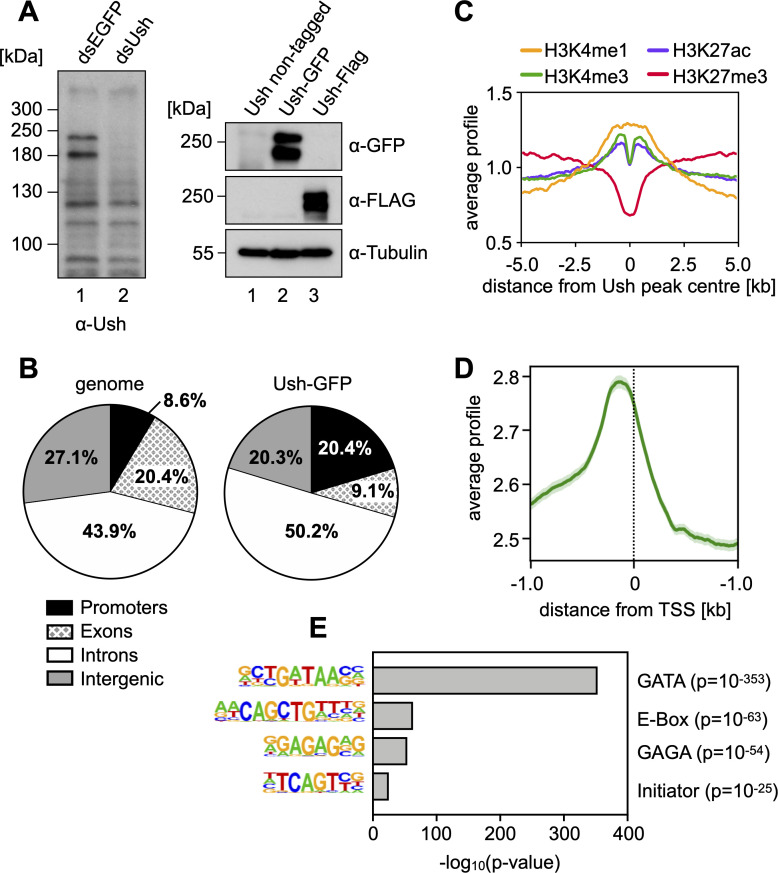
Fig 1. Ush is expressed in S2 cells and binds to regulatory elements.
A Left panel: S2 cells were transfected with control dsRNA (dsEGFP) or dsRNA against Ush (dsUsh) and harvested after four days. Whole cell lysates were probed on Western blot using an antibody against Ush. Right panel: A GFP- or FLAG-tag sequence was inserted at the 3’ end of the Ush gene in S2 cells using CRISPR/Cas9-mediated genome editing. Nuclear extracts of control cells and cells expressing Ush-GFP or Ush-FLAG was probed on Western blot using a GFP or FLAG antibody. Tubulin signal serves as loading control. B Genomic distribution of Ush-GFP binding sites identified by anti-GFP ChIP-seq. Fraction of Ush peaks found in each genomic location are shown in the right chart. Fractions of genomic locations in the Drosophila genome serve as reference (left chart). C Distribution of histone modifications surrounding Ush-bound regions. Signals of H3K4me1 (yellow), H3K4me3 (green), H3K27ac (blue) and H3K27me3 (red) are displayed within a region of 10 kb surrounding Ush peaks. D Distribution of Ush occupancy at transcription start sites (TSS). Average Ush binding (green) was evaluated in a 2 kb region surrounding all genomic TSS. Standard error is depicted in light green. E Analysis of DNA sequence motifs enriched at Ush binding sites. The enriched motif is depicted on the left and the corresponding transcription factor on the right. The -log10(p-value) for the enrichment of each motif is plotted and p-values are indicated on the right.

