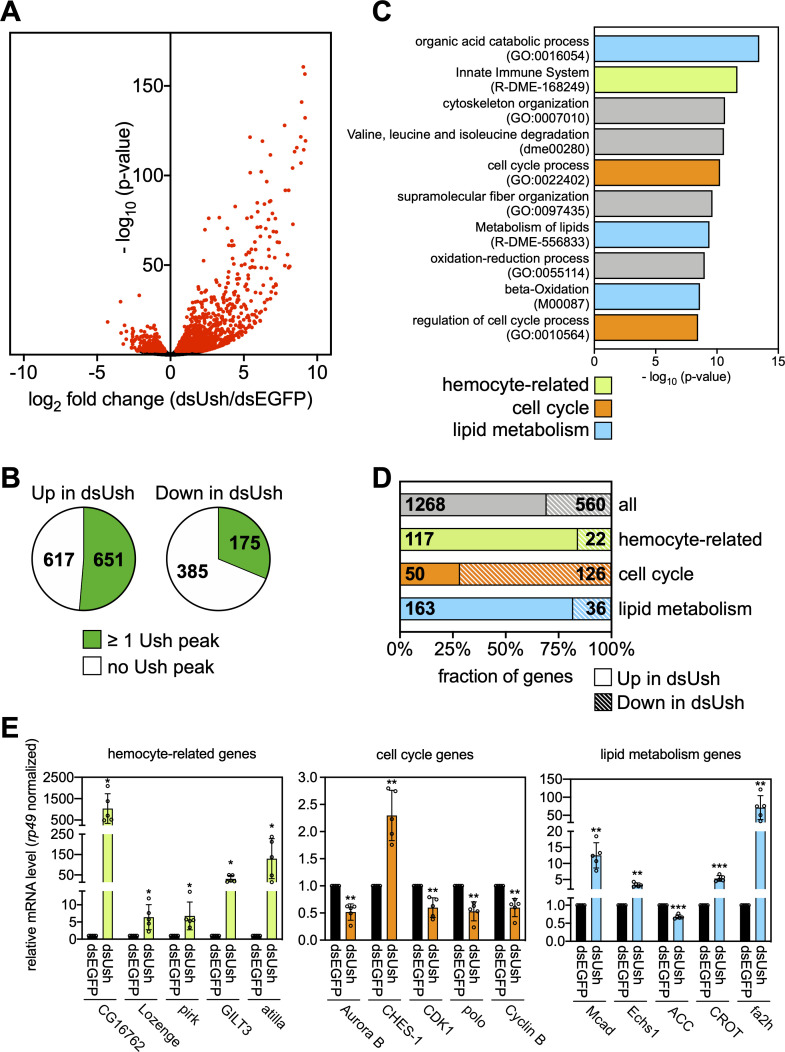
Fig 2. Ush regulates the S2 cell transcriptome.
A Volcano plot of deregulated genes upon depletion of Ush in S2 cells. The -log10(p-value) is plotted against the log2 fold change of counts per gene in Ush-depleted (dsUsh) vs. control cells (dsEGFP). Red dots represent significantly deregulated genes (adj. p < 0.01) obtained from biological triplicates (n = 3). B Enrichment of Ush at Ush-regulated genes. Fraction of genes repressed (left chart) or activated by Ush (right chart) that contain at least one Ush peak is indicated in green. C Gene ontology analysis of Ush-regulated genes. GO terms associated with lipid metabolism (blue), hemocyte-specific functions (green) and cell cycle (orange) are highlighted respectively. D Genes contributing to the three GO term classes were divided into a Ush-activated (shaded) and a Ush-repressed (solid) fraction. The entirety of all Ush-regulated genes serves as reference (grey). Gene numbers in each fraction are indicated. E Representative genes from all three gene classes were analysed upon depletion of Ush (dsUsh) by RT-qPCR. Gene names are indicated below. Expression was calculated relative to control treated cells (dsEGFP) and normalised using the mRNA levels of rp49. Error bars represent the standard deviation from biological replicates (n = 5) (T-test: *** p < 0.001, ** p < 0.01, * p < 0.05). Individual values of each replicate are displayed as circles.

