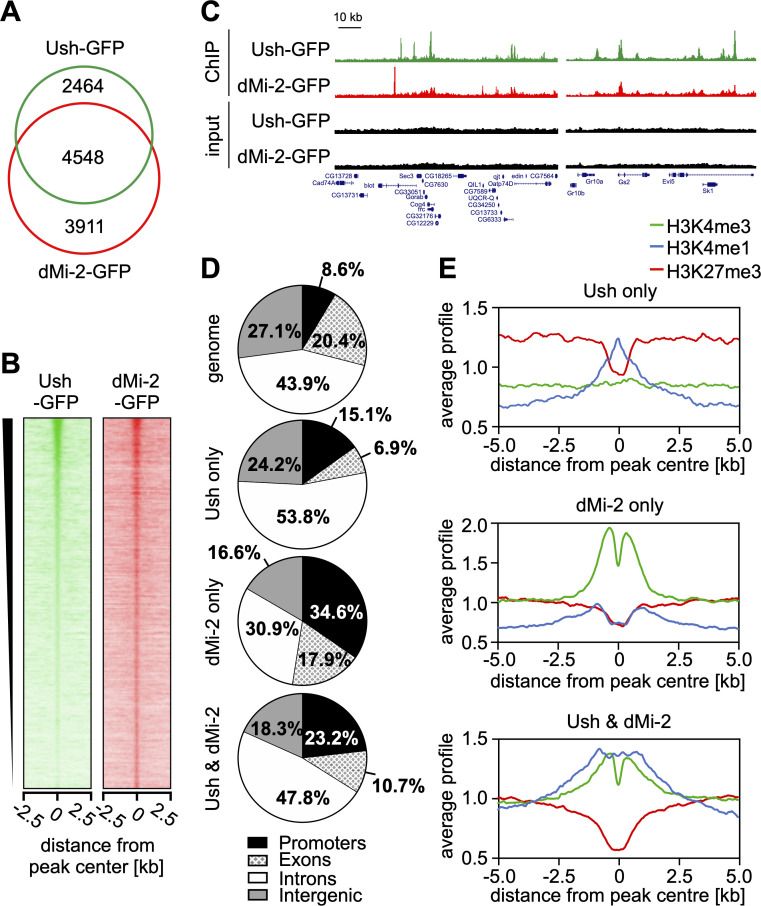
Fig 5. Ush and dMi-2 co-localise on chromatin.
A Venn diagram of loci bound by Ush-GFP (green) and dMi-2-GFP (red) determined by anti-GFP ChIP-seq. Numbers of peaks are indicated in each section. B Heatmap of Ush-GFP and dMi-2-GFP signals centred at Ush-bound regions and sorted by Ush signal intensity. A region of 5 kb surrounding the Ush peak is displayed. C Genome browser snapshots of exemplary regions displaying Ush (green) and dMi-2 (red) occupancy. Input signals are shown in black. Location of genes is displayed below with boxes indicating exons. Scale bar represents a distance of 10 kb. D Genomic distribution of regions identified by anti-GFP ChIP-seq that were bound by Ush only, dMi-2 only or by both Ush and dMi-2 (indicated on the left). Fraction of peaks found in each genomic location are displayed. Fractions of genomic locations in the Drosophila genome serve as reference (top chart). E Distribution of histone modifications surrounding regions bound by Ush only (top), dMi-2 only (middle) or both Ush and dMi-2 (bottom). Signals of H3K4me3 (green), H3K4me1 (blue) and H3K27me3 (red) are displayed within a region of 10 kb surrounding peak centres.

