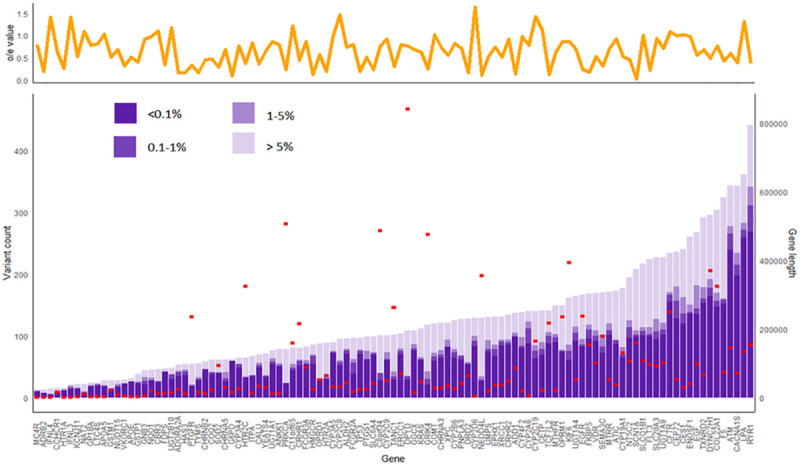
Fig 1. Allele frequency of variants within the 108 pharmacogenes in the dataset.

In the upper panel, the yellow line graph shows the gnomAD loss-of-function constraint metric (o/e score) of the respective genes. In the lower panel, the purple bars denote the variant counts in the 108 high-confidence pharmacogenes, while the red rectangles indicate respective gene transcript lengths. Consistent across genes, most variants belong to the very rare category (AF <0.1%). The relationship between variant count, gene transcript length, and constraint (o/e score reported in gnomAD) was analyzed using multiple linear regression analysis. There was significant association between gene transcript length and total variant count (P = 0.0073). In general, the number of variants increased by 0.17 for every kilobase increase in gene length, although outliers existed. In the highly polymorphic gene CYP2D6, 29.5 variants were observed for every kilobase of gene length.
