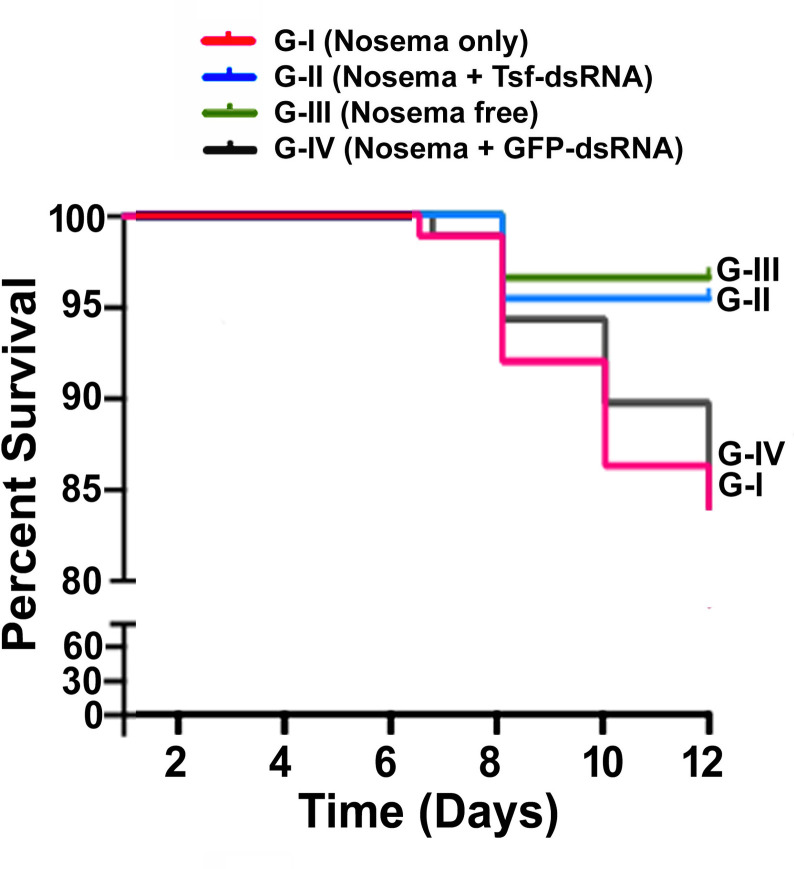
Fig 11. Kaplan–Meier survival curves for the three experimental groups (N = 90 bees/group).
Data represent percentage of survival for the four groups over 12 days of experimental observation. Group I: Nosema-infected bees (infected/untreated); Group II: Nosema-infected bees + AmTsf -dsRNA treatment (infected/treated); Group III: Healthy bees (uninfected/untreated) and Group IV: Nosema-infected bees + GFP-dsRNA. Knockdown of the honey bee transferrin gene reduced the incidence of death (p< 0.05 by Wilcoxon test <p = 0.0041> and Log-rank test <P = 0.0033>).

